. 2021 Nov 30;10:e70982. doi: 10.7554/eLife.70982

Figure 8. Rab11 interacts with the maturing endosome independently of Rab5 or Rab7.

HeLa cells, stably expressing mApple-Rab5 (A–D) or mApple-Rab7 (E–H) and transiently transfected with GFP-Rab11, were treated for 20 min with nigericin, washed and imaged over 3 h, as described in Figure 4A. (A,E) Time-lapse images of a representative endosome to show continuous Rab11 interaction with the maturing endosome relative to Rab5 (A) or Rab7 (E) recruitment. Time-lapse videos of the endosomes in (A,E) at 1 min interval are available in Figure 8—videos 1 and 4. Additional videos of endosomes at 2 s interval to show Rab11 circling around the enlarged Rab5 positive compartments are available in Figure 8—videos 2 and 3. (B,F) Corresponding graphs of normalised mean fluorescence intensity of Rab5 (B) or Rab7 (F) and Rab11 at the rim of the endosome in (A) or (E), respectively, over the time the endosome was detectable. (C,G) Averaged Rab5 (C) or Rab7 (G) and Snx1 kinetics of 16 and 15 endosomes, respectively. Error bars represent standard deviation. Representative graphs each of three independent experiments. Numerical data for all analyzed endosomes is available in Figure 8—source data 1 and Figure 8—source data 3. (D,H) Images of Rab5 (D) or Rab7 (H) and Rab11 at an enlarged endosome and corresponding line profiles of normalized fluorescence intensity along the rim to show co-existence as well as independence of subdomains of Rab11 and the two markers. Scale bar = 2 μm. Numerical data for analyzed endosomes is available in Figure 8—source data 2 and Figure 8—source data 4.

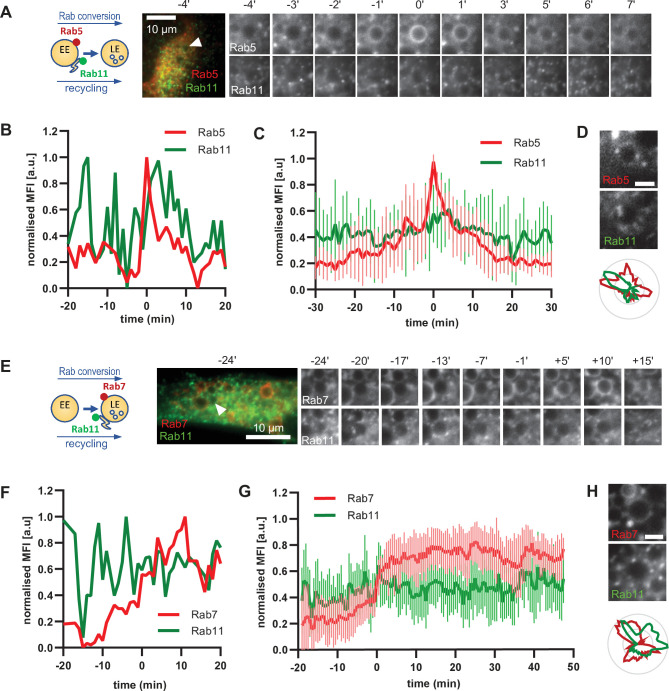
Figure 8—source data 1. Quantification of Rab5 and Rab11 recruitment at endosomes.
Figure 8—source data 2. Quantification of Rab5 and Rab11 subdomains at endosomes.
Figure 8—source data 3. Quantification of Rab7 and Rab11 recruitment at endosomes.
Figure 8—source data 4. Quantification of Rab7 and Rab11 subdomains at endosomes.

Figure 8.

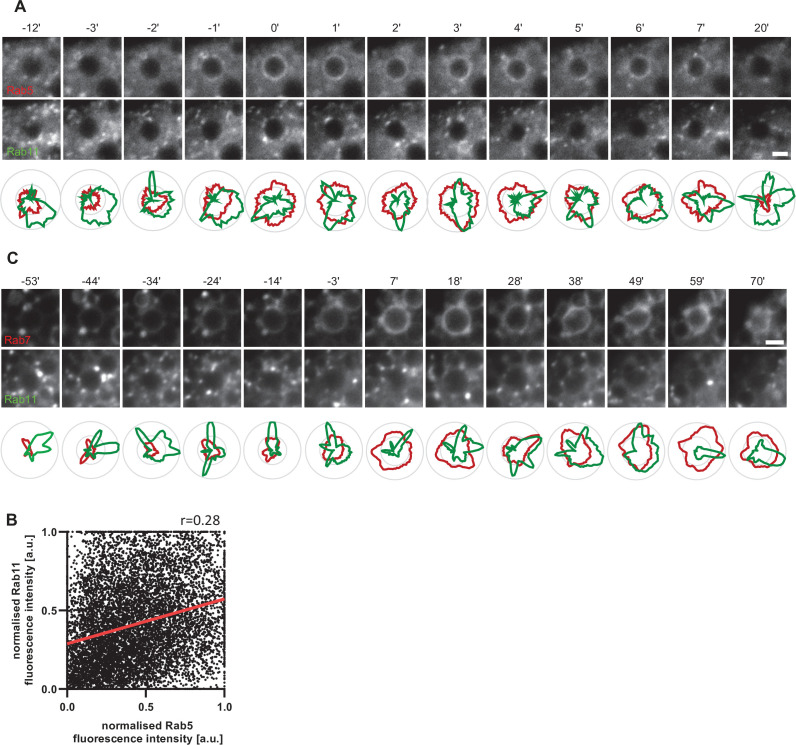
Figure 8—figure supplement 1. Rab11 interacts with the maturing endosome independently of Rab5 or Rab7.

Figure 8—figure supplement 1.

HeLa cells, stably expressing mApple-Rab5 (A,B) or mApple-Rab7 (C) and transiently transfected with GFP-Rab11, were treated for 20 min with nigericin, washed and imaged over 3 hr, as described in Figure 4A. (A,C) Images and corresponding line profiles of normalised fluorescence intensity of Rab5 (A) or Rab7 (C) and Rab11 along the rim of the maturing endosome at consecutive time points. Rab5/Rab7 was adjusted for a single maximum and minimum values during the recorded kinetic to highlight its overall signal increase. Rab11 was adjusted for maximum and minimum values for each time point to highlight the dynamic nature of Rab11 interactions with the maturing endosome. Scale bar = 2 μm. (B) Correlation plot of normalised fluorescence intensity of Rab5 and Rab11 as measured in Figure 8D for 14 endosomes for a total of 193 time points, and a corresponding regression line. Pearson’s correlation r = 0.28. Numerical data for all analysed endosomes is available in Figure 8—figure supplement 1—source data 1 and 2.
Figure 8—figure supplement 1—source data 1. Quantification of Rab5 and Rab11 subdomains at endosomes in Figure 8—figure supplement 1A.
Figure 8—figure supplement 1—source data 2. Numerical data for all analysed endosomes plotted in Figure 8—figure supplement 1A.
Figure 8—video 1. Rab11 interaction with the maturing endosome relative to Rab5.
Download video file (143.5KB, mp4)
Figure 8—video 2. Rab11 circling around the enlarged Rab5 positive compartments.
Download video file (1.1MB, mp4)
Figure 8—video 3. Rab11 circling around the enlarged Rab5 positive compartments.
Download video file (570.2KB, mp4)
Figure 8—video 4. Rab11 interaction with the maturing endosome relative to Rab7.
Download video file (140.9KB, mp4)