Figure 1. Comparison between total number of cases amongst healthcare workers (HCWs) and community incidence of severe acute respiratory syndrome coronavirus 2 (SARS-CoV-2).
Comparison between total number of cases amongst HCWs and community incidence of SARS-CoV-2. Community incidence is shown for the East of England, UK, derived from https://coronavirus.data.gov.uk/details/cases, with raw data shown in Figure 1—source data 1.
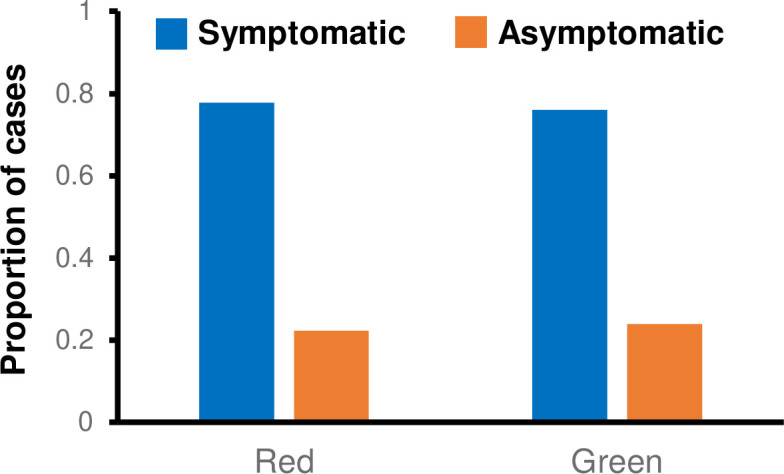
Figure 1—figure supplement 1. Proportion of cases ascertained by symptomatic testing and asymptomatic screening on green and red wards.

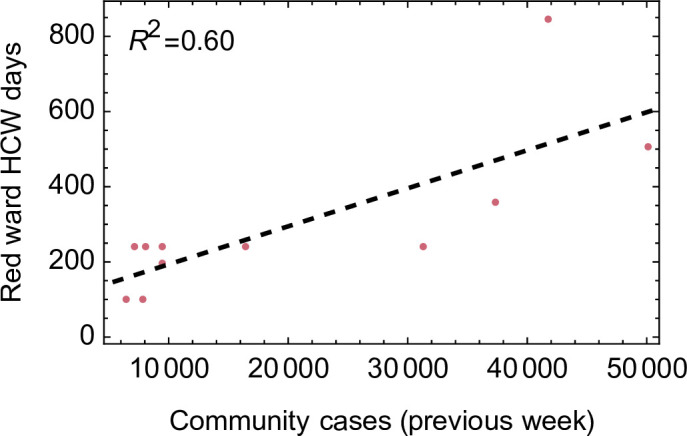
Figure 1—figure supplement 2. Relationship between number of healthcare worker (HCW) days per week worked on red wards and community incidence.


