. 2021 Nov 16;10:e71131. doi: 10.7554/eLife.71131

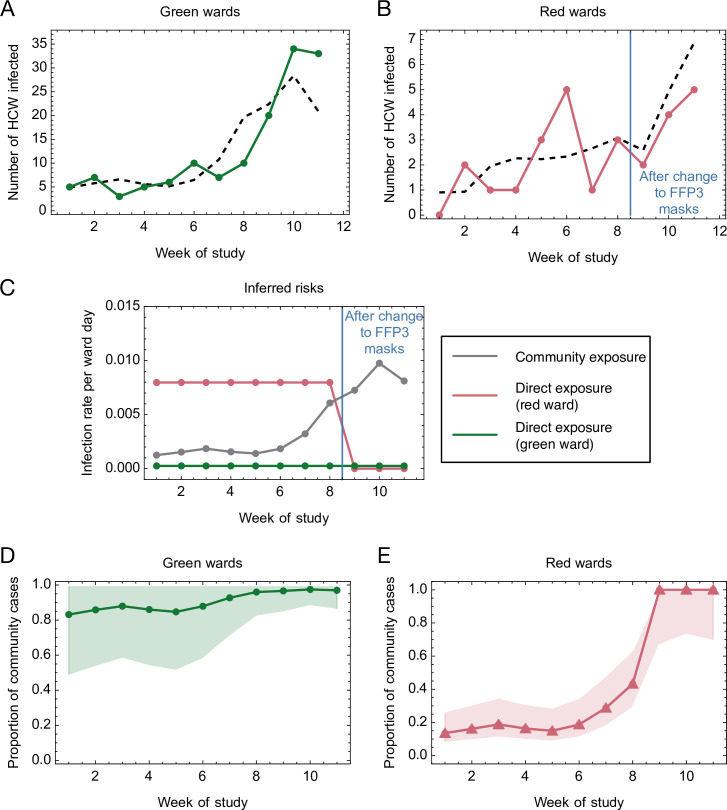
Figure 3. Mathematical modelling of the risks of infection for healthcare workers (HCWs) on red and green wards.

(A, B) Comparison of modelled and actual cases. The model (black dashed line) aimed to reproduce the risks of infection amongst HCWs per ward day (A) on green wards (green solid line) and (B) on red wards (red solid line). (C) Risks inferred from the model. HCWs were vulnerable to coronavirus disease 2019 (COVID-19) infection from exposure to individuals in the community, with this risk increasing with community incidence (grey line). HCWs working on green wards faced a consistent, low risk of infection from direct, ward-based exposure (green line). HCWs working on red wards initially faced a much higher risk of infection from direct, ward-based exposure, falling to a value close to that on green wards upon the introduction of filtering face piece 3 (FFP3) respirators. In this figure, risks are expressed per ward day; a risk of 0.01 indicates that a particular source of risk would be expected to cause one HCW to develop an infection every 100 days that the ward was in operation. (D, E) Proportion of community-acquired cases. Proportion of infections on (D) green and (E) red wards inferred to have arisen via exposure to individuals in the community (green line, green wards; red line, red wards; confidence intervals shaded).

Figure 3—source data 1. Mathematical modelling of the risks of infection for healthcare workers (HCWs) on red and green wards.

Figure 3.

Figure 3—figure supplement 1. Effect of changing the attribution of positive cases to wards in which a contemporaneous designation change occurred (e.g. from green to red).
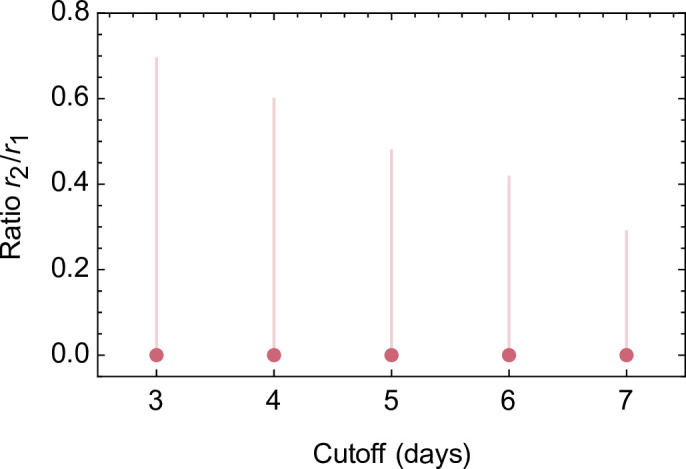
Figure 3—figure supplement 1.

Cases were by default attributed to the type of ward on which each positive-testing healthcare worker (HCW) worked 5 days prior to reporting symptoms (if symptomatic) or testing positive (if asymptomatic). This analysis examines how maximum likelihood inferences (dots) and confidence intervals (lines) change upon varying the 5 day cutoff to between 3 and 7 days. A ratio of 0.4 corresponds to a 60 % reduction in HCW risk upon the introduction of filtering face piece 3 (FFP3) respirators.
Figure 3—figure supplement 1—source data 1. Effect of changing the attribution of positive cases to wards in which a contemporaneous designation change occurred.

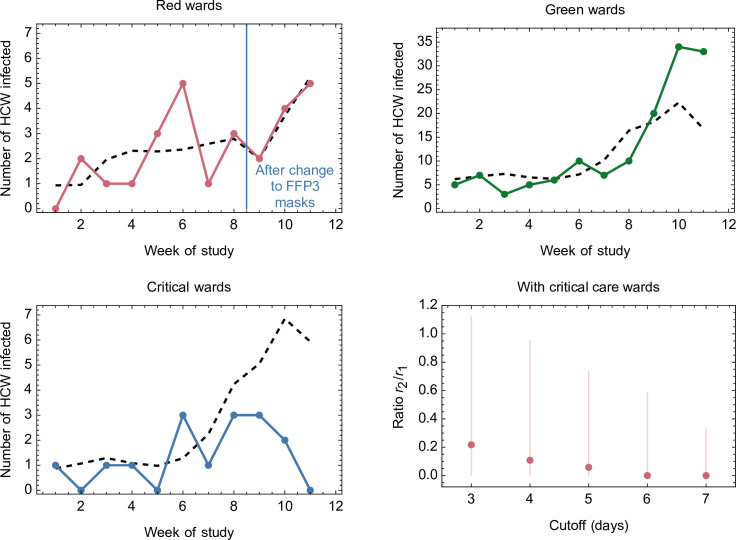
Figure 3—figure supplement 2. Comparison of modelled and actual cases when critical care wards were included in the dataset.

Figure 3—figure supplement 2.

The model (black dashed line) aimed to reproduce the risks of infection amongst healthcare workers (HCWs) per ward day on green wards (green line), red wards (red solid line), and on critical care wards (blue line). Red dots show the maximum likelihood ratio between ward-specific risks to HCWs on red wards before and after the introduction of filtering face piece 3 (FFP3) respirators, with vertical lines indicating 95 % confidence intervals for this statistic. Our model fitted a rate of community-based infection, plus ward-type-specific rates of infection for red, green, and critical care wards.
Figure 3—figure supplement 2—source data 1. Comparison of modelled and actual cases when critical care wards were included in the dataset.