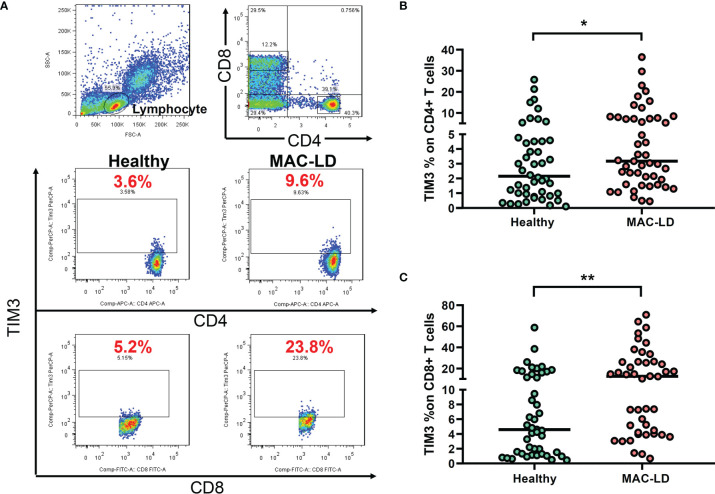
Figure 1.
The expression of TIM3 on CD4+ and CD8+ lymphocytes according to disease status. (A) Case demonstration and (B, C) scatter plots between healthy controls and patients with Mycobacterium avium complex-lung disease (MAC-LD) are shown. The lymphocyte group was discriminated by forward scatter (FSC) and side scatter (SSC). CD4+ and CD8+ cells were then gated within the lymphocytes and TIM3 was measured. The cross bars in the scatter plots are median values. We compared the data by Mann–Whitney U test. One star indicates p < 0.05; and two stars mean p < 0.01.

