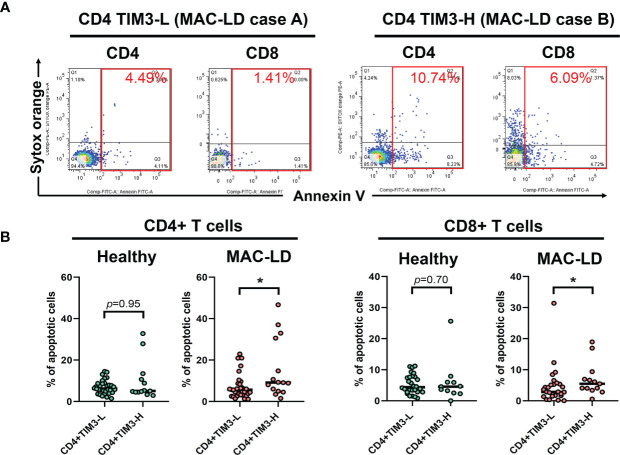
Figure 2.
The expression of apoptosis percentages by CD4+TIM3-low (CD4+TIM3-L) or CD4+TIM3-high (CD4+TIM3-H) subgroups, defined by average TIM3+ level. The figure shows (A) case demonstrations for apoptosis staining (Annexin V and Sytox Orange) and (B) scatter plots comparing apoptosis percentage on CD4+ or CD8+ T cells between CD4+TIM3-H or TIM3-L subgroups among healthy controls or patients with Mycobacterium avium complex-lung disease (MAC-LD). Apoptosis % was the sum of early apoptosis [Anexin V+/Sytox Orange–] and late apoptosis [Annexin V+/Sytox Orange+]. The cross bars in the scatter plots are median values, and the significance was analyzed by the Mann–Whitney U test. One star indicates p < 0.05.

