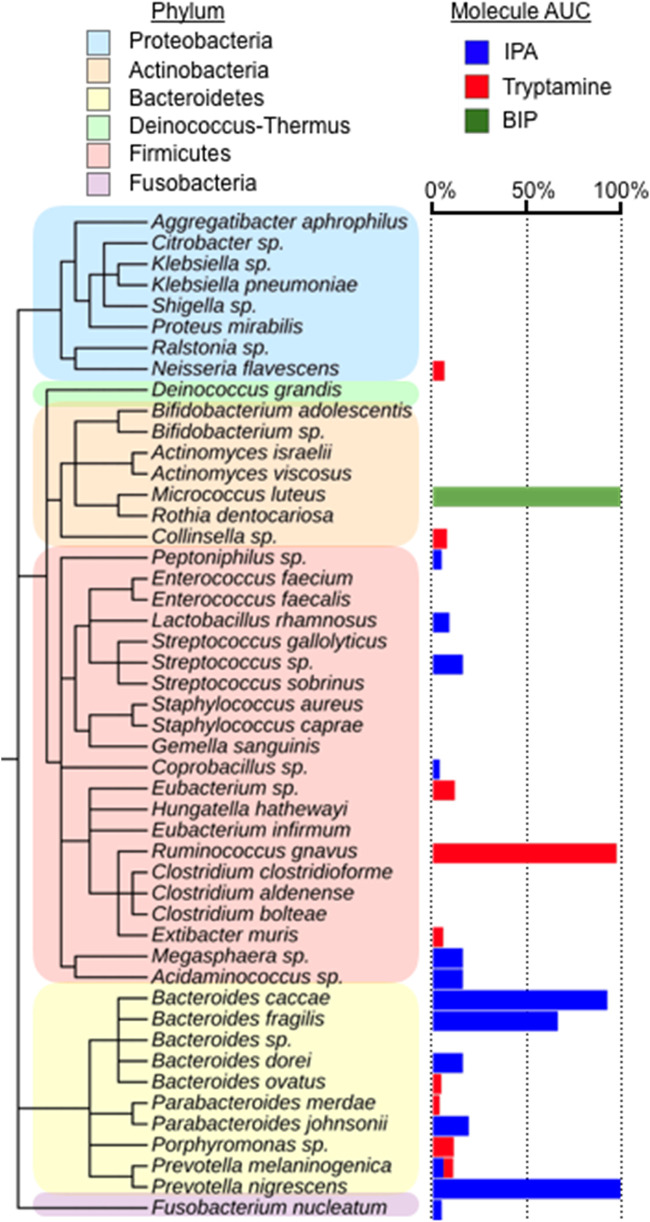
FIG 5.
Distribution of anti-SARS-CoV-2 metabolites among culture broth extracts of human-associated bacteria. Production was measured by HR-MS as the area under the curve (AUC) of a metabolite’s parent ion (0% undetected, 100% highest producer). n = 3. Measurements shown are from a representative culture.

