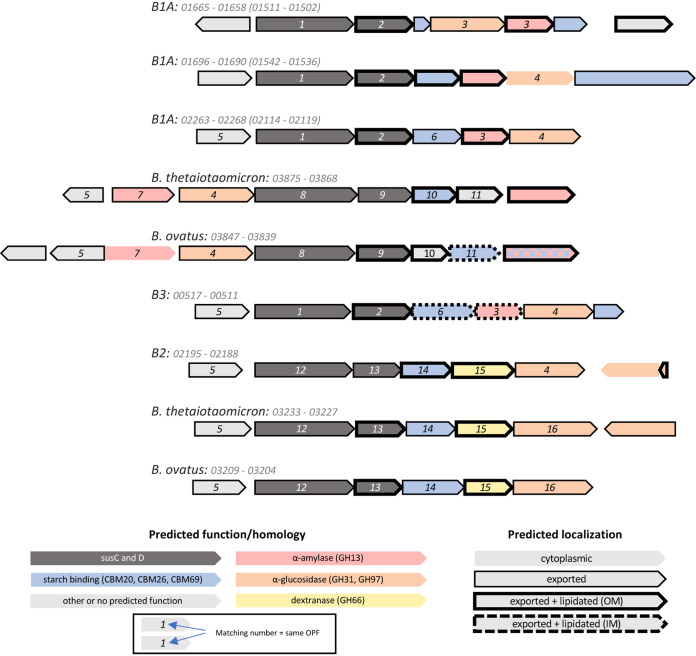
FIG 2.
Diagrams of PULs plausibly reflecting activity on starch and/or dextran in B1A, B2, B3, B. thetaiotaomicron, and B. ovatus. Regions are labeled with the genome name and the interval of gene numbers. For B1A PULs, the matching gene numbers in B1B are noted in parentheses. ORFs are depicted as arrows pointed 5′ to 3′ along the coding sequence, and colors indicate homology to genes and domains known to participate in either starch or dextran utilization. ORF outlines indicate predicted localization based on the presence of an N-terminal signal peptide and nearby residues. Matching numbers indicate homology based on OPF clustering and are arbitrarily assigned (1, Opf01209; 2, Opf02007; 3, Opf02000; 4, Opf00042; 5, Opf01405; 6, Opf02584; 7, Opf01765; 8, Opf00431; 9, Opf09589; 10, Opf15294; 11, Opf14773; 12, Opf01209; 13, Opf03138; 14, Opf04347; 15, Opf04327; 16, Opf16791).

