
FIG 3.
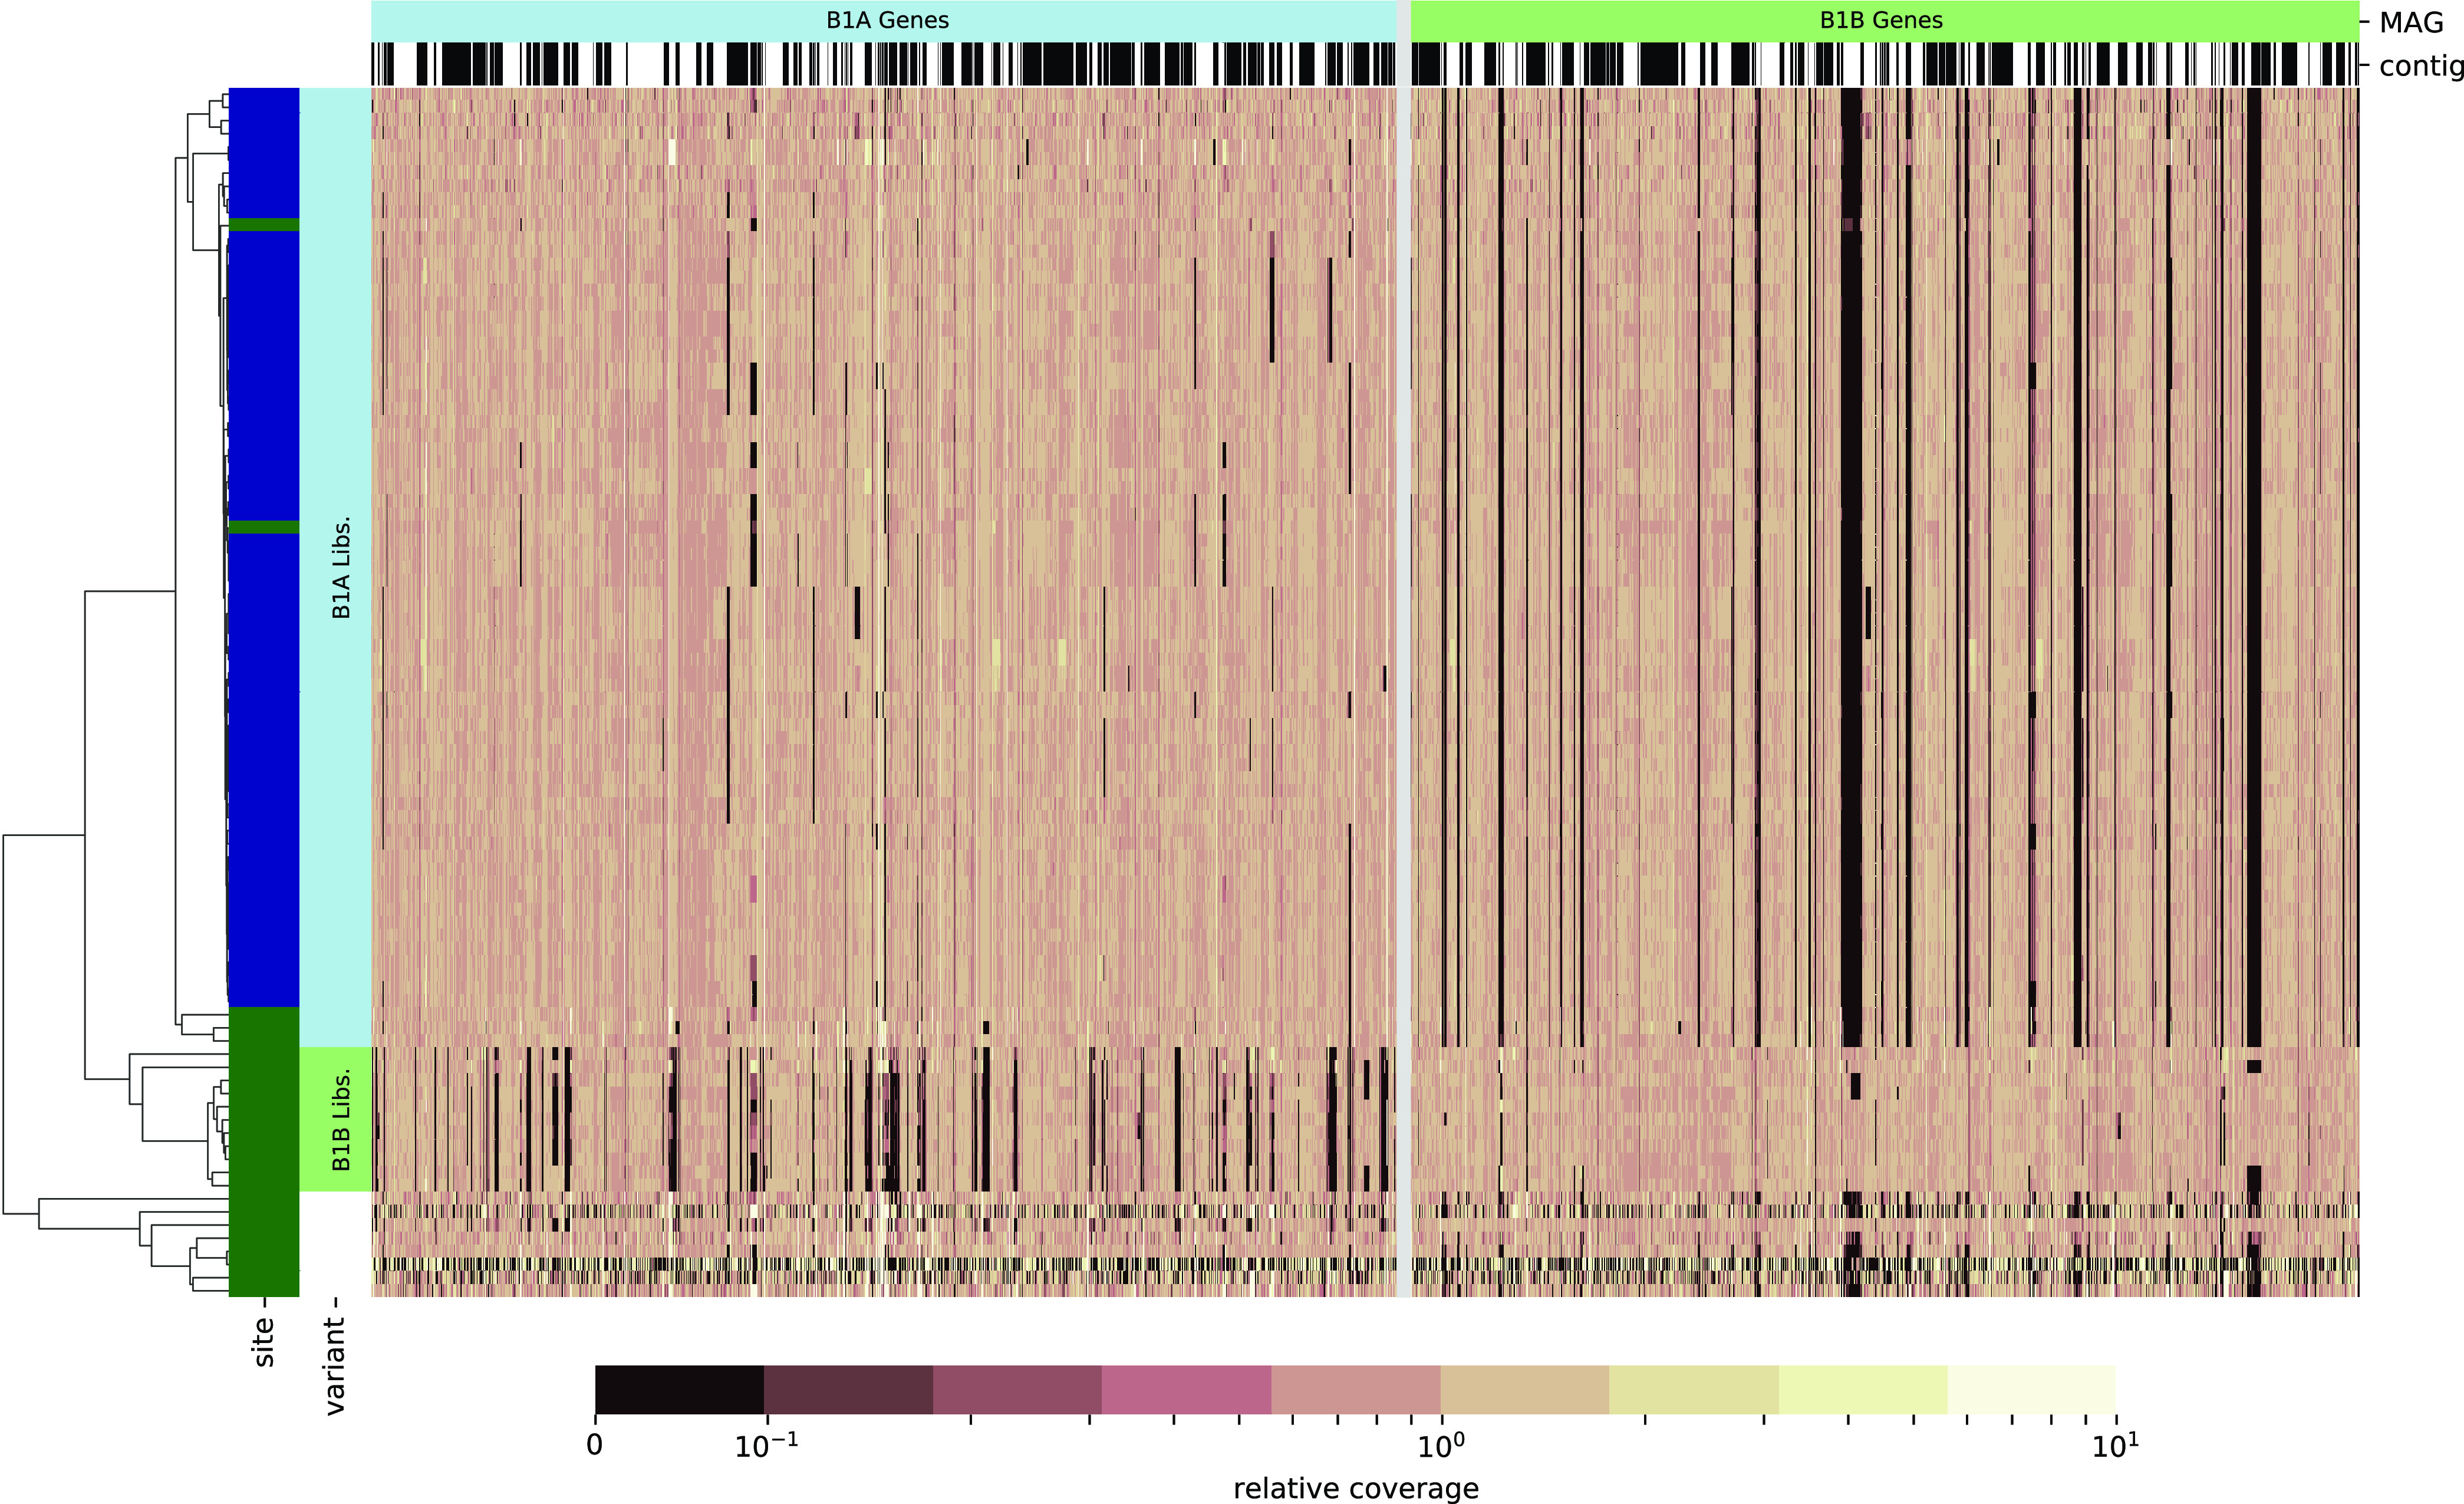
Visualization of differential gene content in two OTU-1 populations. Heatmaps depict relative mapping coverage of metagenomes against putative protein-coding genes in MAGs B1A (left of gray line) or B1B (right). Rows represent one or more pooled libraries for each mouse included in the study, and columns represent individual genes. Alternating black and white spans over heatmap columns indicate contig boundaries in each MAG; the orientation and order of contigs is arbitrary. All coverage values are normalized to the median coverage of that genome’s features within each mouse. The site at which each mouse was housed is indicated by colored spans on the left (UT, dark green; UM, dark blue), and mice identified as unambiguous representations of each population are indicated (B1A, light blue; B1B, light green; uncertain, white). Rows are ordered based on a hierarchical clustering by cosine distance, depicted in the tree on the left.