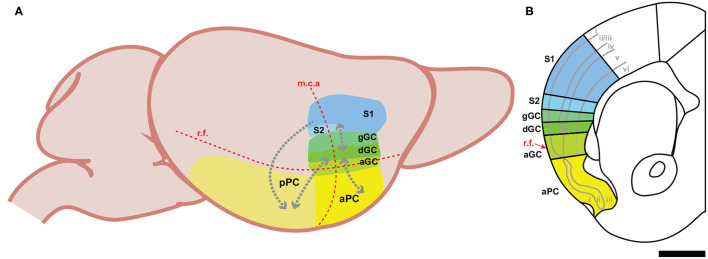
Figure 1.
Schematic representations of the three intraoral cortical regions in the mouse. (A) A lateral view displaying the relationship between the oral-somatosensory cortex, gustatory cortex, and olfactory cortex. The red dotted lines indicate the position of two key landmarks: the rhinal fissure (r.f.) and the middle cerebral artery (m.c.a.). The gray dotted arrows represent the corticocortical connections between regions. aGC, agranular gustatory cortex; dGC, dysgranular gustatory cortex; gGC, granular gustatory cortex; mca, middle cerebral artery; aPC, anterior piriform cortex; pPC, posterior piriform cortex; rf, rhinal fissure; S1, somatosensory cortex, area 1; S2, somatosensory cortex; area 2. (B) A coronal section of the mouse brain containing the oral-somatosensory cortex, gustatory cortex, and piriform cortex. The solid gray lines indicate the divisions between the cortical layers. Note the loss of layer 4 in the dysgranular gustatory cortex. The dotted gray line in the agranular gustatory cortex represents the fading boundary between layer 5 and layer 6, while the red arrow highlights the anatomical position of the rhinal fissure (r.f.). Black bar is 1 mm.

