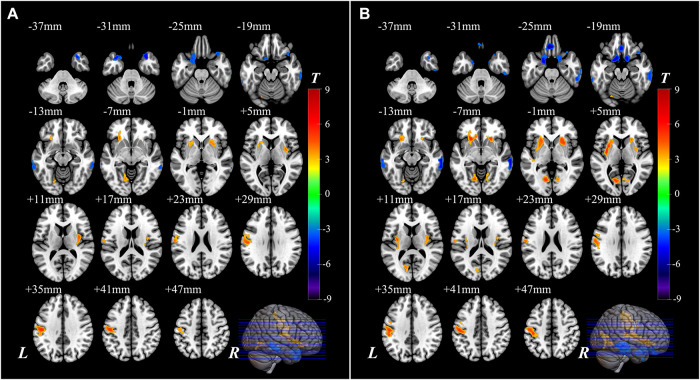
FIGURE 3.
The brain regions with significant intergroup differences of the CBF-ReHo ratio. The voxel-based analysis demonstrates the survived clusters between the HC group and PD-NC group (A) and PD-MCI group (B). These clusters are referred to multiple comparisons correction using the FWE rate (a cluster-defining threshold of P = 0.001 and a corrected cluster significance of P < 0.05). The significantly increased ratio relative to HC in the group is shown with warm color. The significantly decreased ratio relative to HC in the group is shown with cold color. CBF, cerebral blood flow; ReHo, regional homogeneity; HC, healthy control; PD, Parkinson’s disease; NC, normal cognition; MCI, mild cognitive impairment; FWE, familywise error; R, right; L, left.

