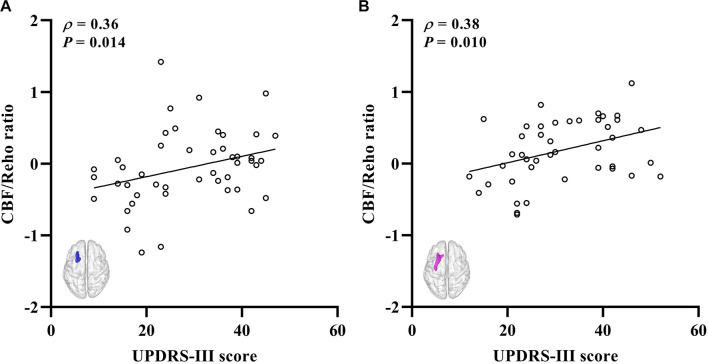
FIGURE 4.
The correlations between the CBF-ReHo ratio and scores of disease severity. (A) Correlations for the PD-NC group between the scores of UPDRS-III (X-axis) and CBF-ReHo ratio in left putamen (Y-axis); (B) correlations for the PD-MCI group between the scores of UPDRS-III (X-axis) and CBF-ReHo ratio in left putamen (Y-axis). CBF, cerebral blood flow; ReHo, regional homogeneity; PD, Parkinson’s disease; NC, normal cognition; MCI, mild cognitive impairment; UPDRS, Unified Parkinson’s Disease Rating Scale.

