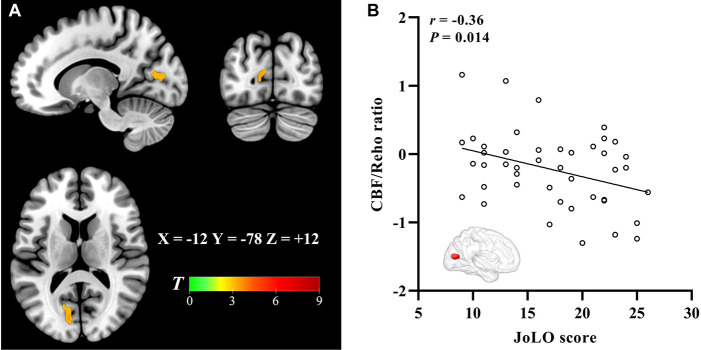
FIGURE 5.
The brain regions with the significant CBF-ReHo ratio difference between PD-MCI and PD-NC groups and correlation to visual–spatial function. The voxel-based analysis demonstrates the survived clusters between PD-MCI and PD-NC groups (A). These clusters are referred to multiple comparisons correction using the FWE rate (a cluster-defining threshold of P = 0.001 and a corrected cluster significance of P < 0.05). Significantly increased ratio relative to PD-NC in the group is shown with warm color. (B) Correlations between the scores of JoLO (X-axis) and CBF-ReHo ratio values in the left lingual gyrus (Y-axis). CBF, cerebral blood flow; ReHo, regional homogeneity; PD, Parkinson’s disease; NC, normal cognition; MCI, mild cognitive impairment; FWE, familywise error; JoLO, Benton’s Judgment of Line Orientation.

