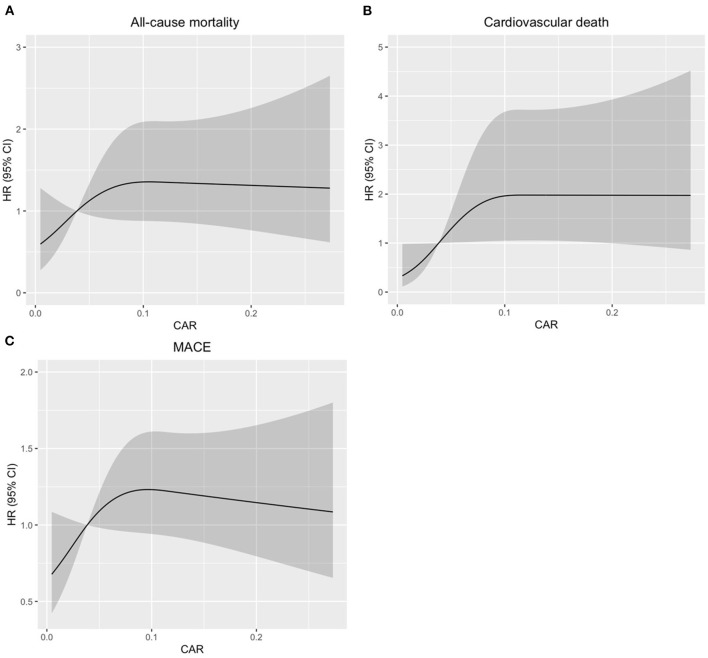
Figure 3.
Restricted spline curves for the associations between CAR and all-cause mortality, cardiovascular death, or MACE in patients with coronary total occlusion (CTO) undergoing percutaneous coronary intervention (PCI). Black lines represent the hazard ratio (HR), gray areas represent the 95% CIs. (A), Association between CAR and all-cause mortality. (B), Association between CAR and cardiovascular death. (C), Association between CAR and MACE. The HR (95% CI) were all adjusted according to Model 3 in the Cox analysis.

