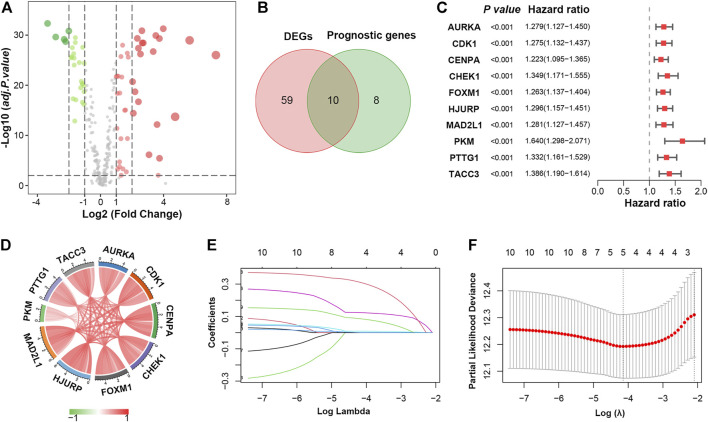
FIGURE 2.
Identification of prognostic cellular senescence-related DEGs. (A). Volcano plot of cellular senescence-related genes in TCGA database; red and green nodes indicate upregulated and downregulated genes, respectively. (B). Venn diagram showing 10 overlapping genes in DEGs and prognostic genes. (C). Forrest plot of the univariate Cox analysis of 10 overlapping genes. (D). Correlation network of 10 candidate genes. (E). LASSO coefficient profiles of 10 candidate genes. (F). Cross-validation for tuning parameter selection in the LASSO regression.

