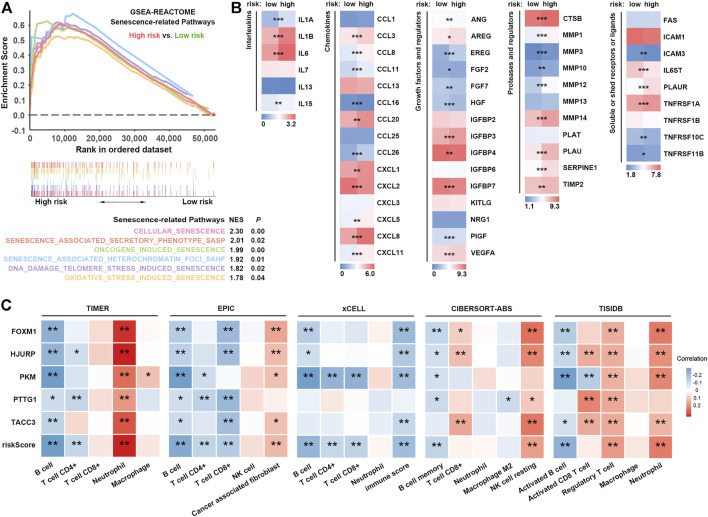
FIGURE 5.
SRS-related SASP and immune cell infiltration. (A). Comparison of signatures related to multiple pathways of cellular senescence between high- and low-risk groups. (B). Expression of different types of SASP factors between high- and low-risk groups. (C). Correlation analysis between risk scores and different immune cells estimated by TIMER, EPIC, xCELL, CIBERSORT-ABS and TISIDB. *, **, and *** represent P < 0.05, P < 0.01, and P < 0.001, respectively.

