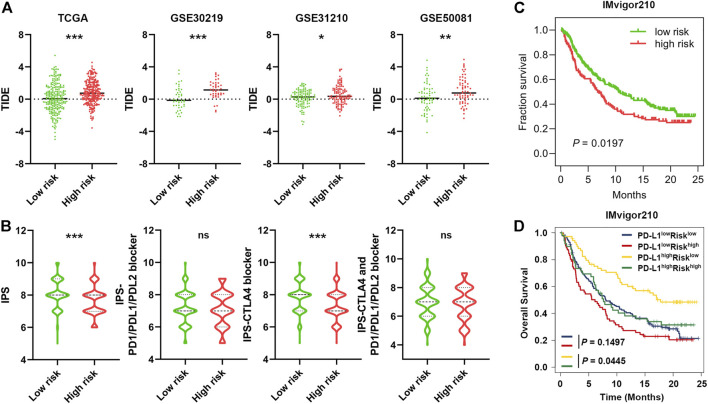
FIGURE 7.
Predictive potential of SRS in immunotherapeutic benefits. (A). The distribution of TIDE scores between patients with a higher SRS score and those with a lower SRS score in four different cohorts as indicated. (B). The distribution of IPS in the high-risk and low-risk groups in the TCGA dataset. (C). Kaplan-Meier curves for high and low SRS score patient groups in the IMvigor210 cohort. (D). Kaplan-Meier curves for four patient groups stratified by SRS and PD-L1 expression. *, **, and *** represent P < 0.05, P < 0.01, and P < 0.001, respectively.

