
FIGURE 5.
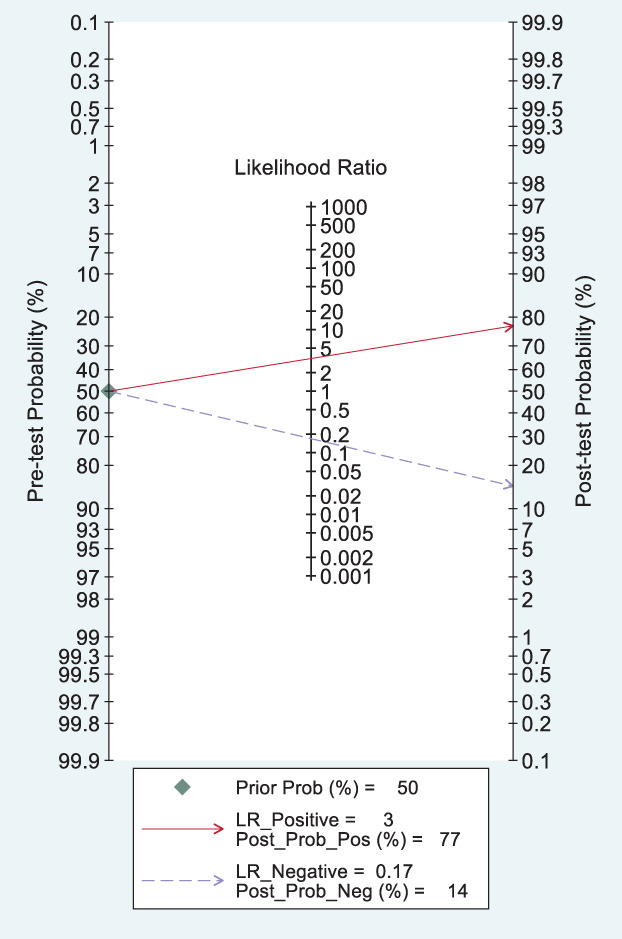
Fagan's plot for the post‐test probability of breast cancer after a positive result (upper line) or a negative result (lower line) from a dynamic contrast‐enhanced magnetic resonance imaging examination. LR, likelihood ratio
Official websites use .gov
A
.gov website belongs to an official
government organization in the United States.
Secure .gov websites use HTTPS
A lock (
) or https:// means you've safely
connected to the .gov website. Share sensitive
information only on official, secure websites.
Fagan's plot for the post‐test probability of breast cancer after a positive result (upper line) or a negative result (lower line) from a dynamic contrast‐enhanced magnetic resonance imaging examination. LR, likelihood ratio