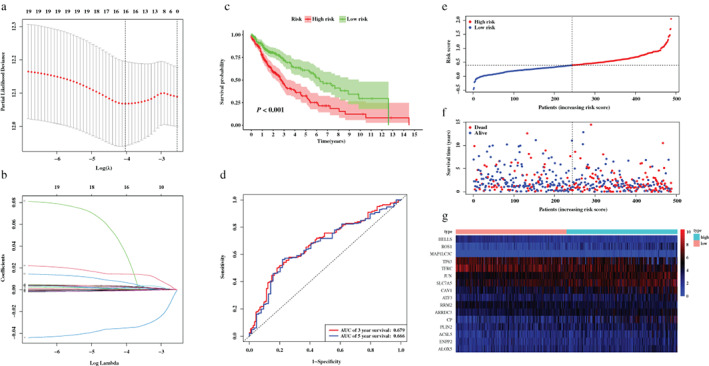
FIGURE 3.

Development of the prognostic signature based on 16 ferroptosis‐related genes (FRGs) in the training set. (a,b) LASSO regression analysis identified 16 FRGs. (c) Survival analysis between risk groups defined by prognostic signature. (d) Time‐dependent receiver operator characteristic curve for predicting overall survival of the prognostic signature. (e) The distribution of risk score of each patient. (f) Survival statuses of patients in different groups. (g) Heatmap of expression profiles of FRGs incorporated in the signature
