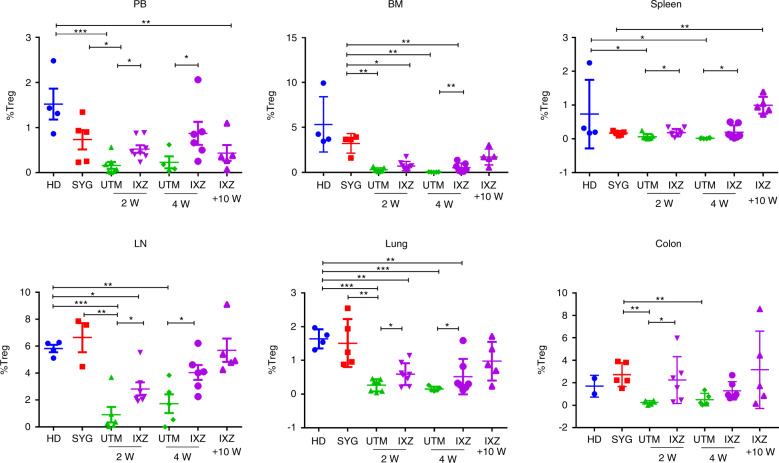
Fig. 3. Ixazomib treatment significantly increases the regulatory T cells.
Percentage of Treg in CD45+ population (CD45+ CD3+ CD4+ CD25+ Foxp3+) in the different organs analyzed. Data are shown as mean ± SEM. Data are collected from 4–5 independent experiments with 5–6 mice per group. *P < .05, **P < .01, and ***P < .001. UTM: untreated transplanted mice (vehicle administration); IXZ: ixazomib group; HD: healthy donor; SYG: syngeneic group; 2/4 and +10 W: weeks after starting the treatment. P values were calculated using 1-way ANOVA and 2-sided Student’s unpaired t-test.

