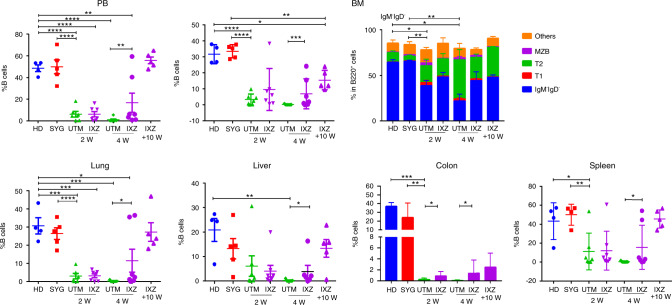
Fig. 4. Ixazomib treatment increases the recovery of B cells.
Flow cytometry analysis of B cells (CD45+ CD19+) in the PB and in the different organs. The distribution of the different B cell maturation in the BM panel represents the results from pcGVHD. Data are shown as mean ± SEM. Data are collected from 4–5 independent experiments with 5–6 mice per group. *P < .05, **P < .01, and ***P < .001. 2-sided Student’s unpaired t-test UTM: untreated transplanted mice (vehicle administration); IXZ: ixazomib group; HD: healthy donor; SYG: syngeneic group; 2/4 and +10 W: weeks after starting the treatment. MZB: Marginal Zone B Cells B220+ CD23− /lowCD21+; T1: transitional T1 (B220+ CD21+ IgM+); T2: transitional T2 (B220+ CD21− IgM+).

