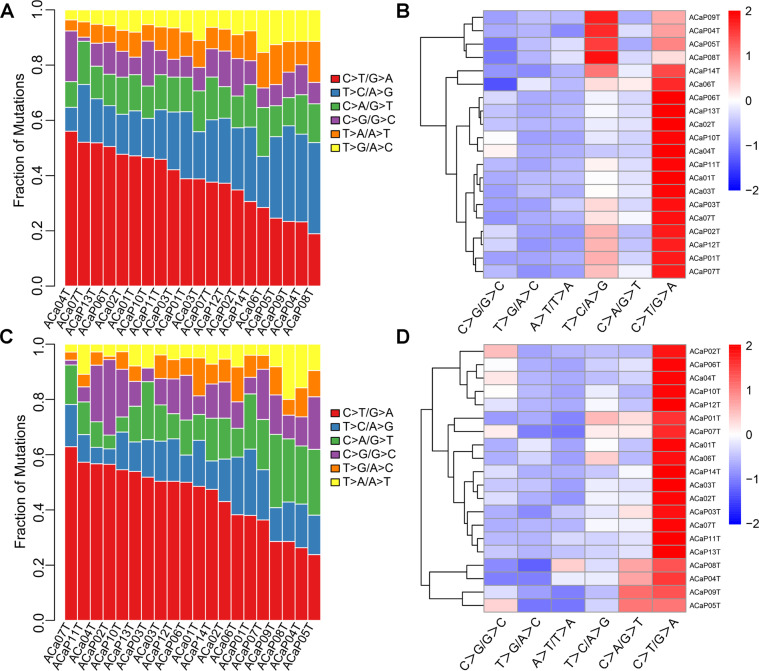
Fig. 3. Distribution of single-nucleotide variations in different adenocarcinoma samples.
A Column diagram of various mutations identified by WGS. B Clustered heatmap of various types mutations in 20 cases by WGS. In the heatmap, blue represents downregulated expression, red represents upregulated expression, and white represents no change in expression. C Column diagram of various mutations identified by WES. D Clustered heatmap of various types mutations in 20 cases by WES. WES whole-exome sequencing, WGS whole-genome sequencing.

