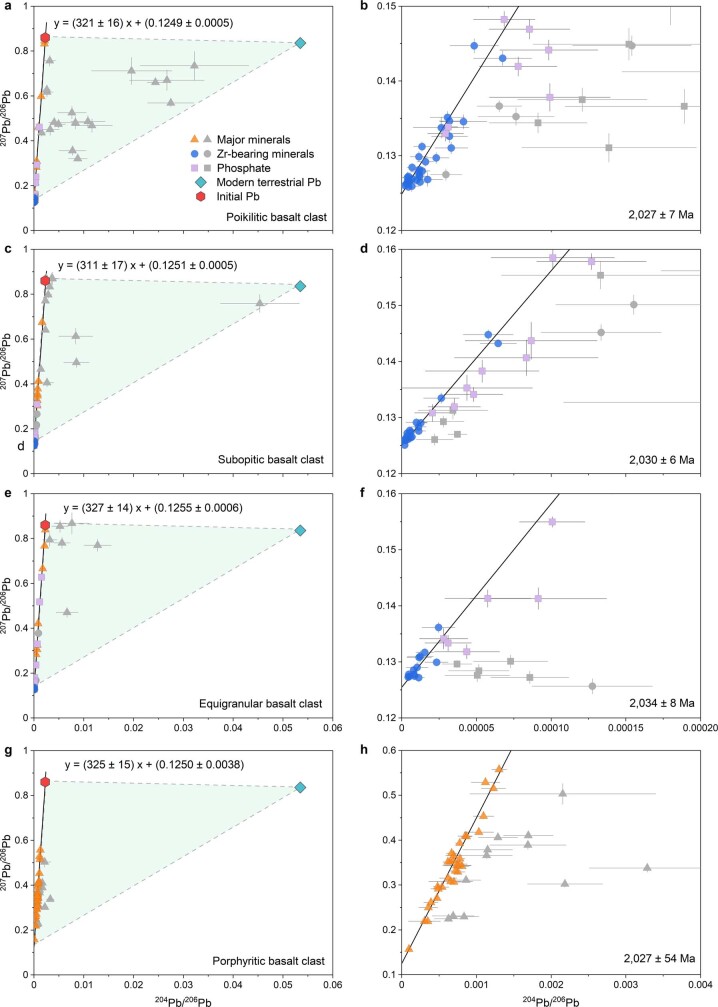
Extended Data Fig. 3. Pb–Pb isochrons for the Chang’e-5 basalts with different textures.
The left four plots (a, c, e and g) show the data from basalt clasts with poikilitic, subophitic, equigranular and porphyritic textures, respectively. The equations of isochrons (black lines) are shown on the top. The right four plots (b, d, f and h) are the enlarged lowest portions of the isochrons highlighting the measurements with low 204Pb/206Pb. The red hexagon represents the initial Pb determined from the integrated isochron, but is not included in each separated isochron. The triangle areas represent the mixing trend among the initial Pb component, the radiogenic Pb, and current terrestrial Pb composition. Outliers excluded from the calculation of the isochron regression are shown in grey while those data used for the leftmost isochron are shown in colour. Error bars represent 1σ standard error. The uncertainties for the isochron dates are quoted at the 95% confidence level.

