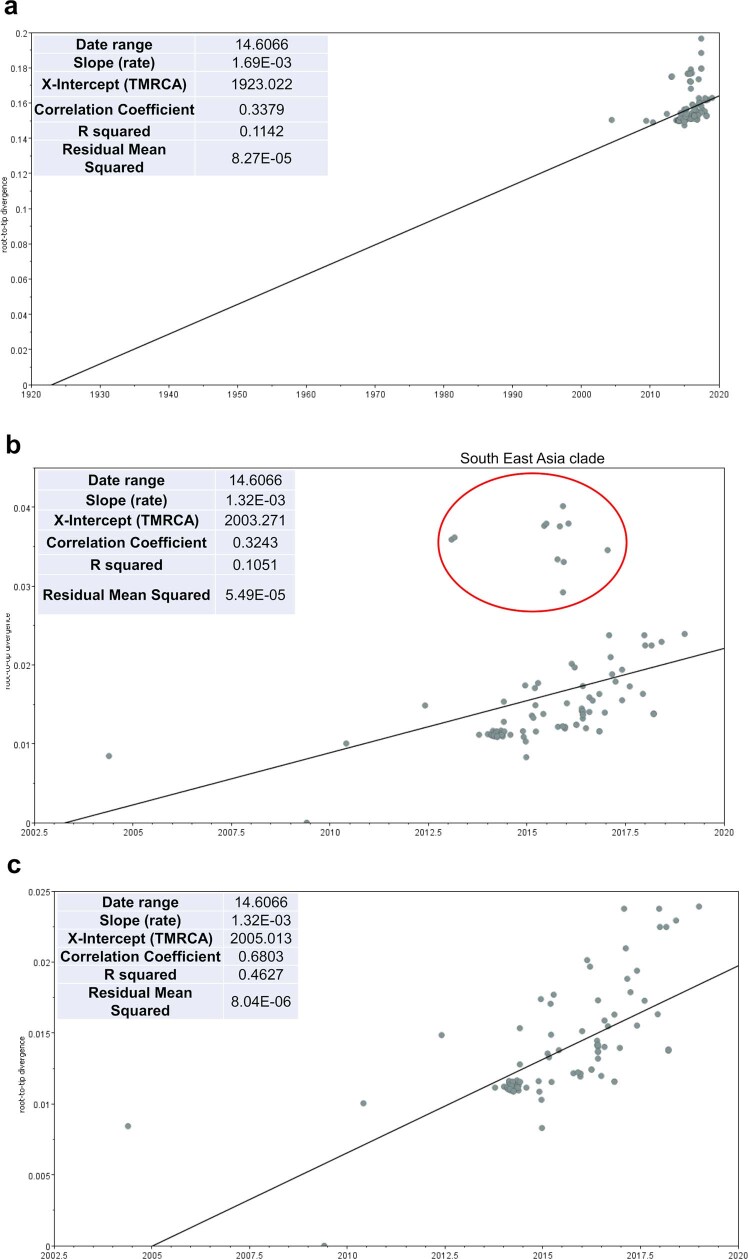
Extended Data Fig. 4. Analysis of the temporal signal with TempEst.
a, b, Root-to-tip distance (y-axis) vs. sampling time linear regression in the ML likelihood phylogeny inferred from: all PDCoV sequences in the final data set (n = 109 sequences) including sparrow outgroup sequences (a); PDCoV sequences without outgroups (n = 105 sequences), with sequences in the red circle belonging to the South East Asia clade (see Fig. 1) showing a clear departure from the strict molecular clock model (b); and PDCoV sequences after removal of the South East Asia clade (n = 94 sequences), showing greatly improved clock signal (R2 = 0.68) (c).

