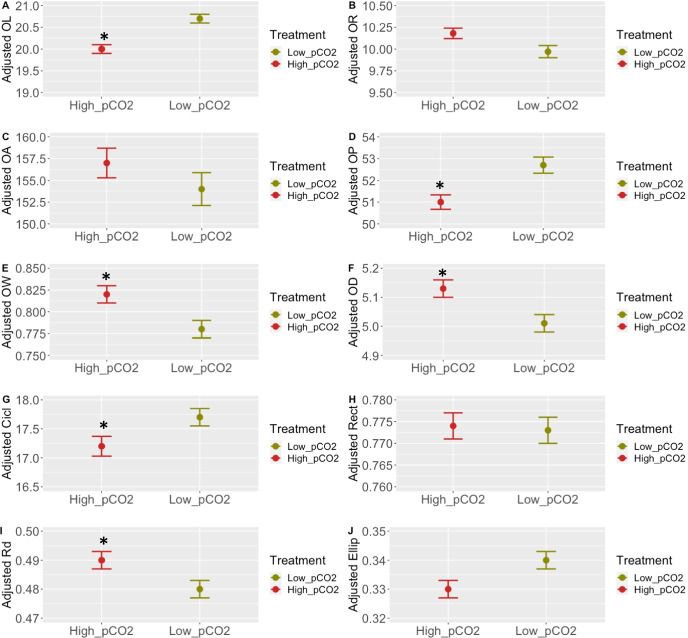
Fig. 1.
Adjusted means for otolith measurements and shape indexes from Atlantic cod exposed to 1091 (high pCO2) and 422µatm (low pCO2) for a period of 30 weeks. Values are expressed as adjusted mean ± SE for 422 (low pCO2; N = 81) (green) and 1091µatm (high pCO2; N = 98) (red) groups. Asterisks indicate significant differences between treatments (*P < 0.05). Otolith length (OL) (A), otolith width (OR) (B), otolith area (OA) (C), otolith perimeter (OP) (D), otolith weight (OW) (E), otolith density (OD) (F), circularity (Cicl) (G), rectangularity (Rect) (H), roundness (Rd) (I) and ellipticity (Ellip) (J)

