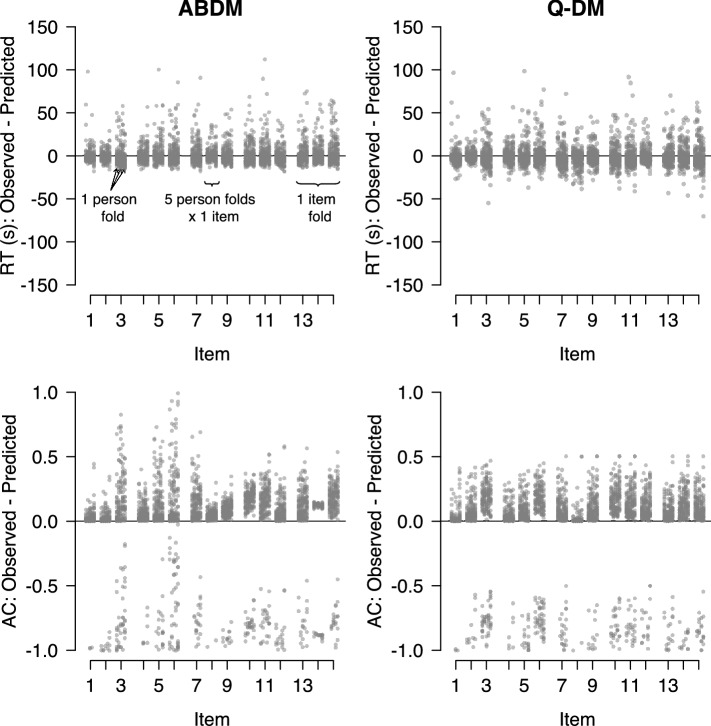
Fig. 12.
Out-of-sample predictions in fivefold cross-validation for the ABDM and the Q-diffusion model. Predictions are based on data from 200 persons and a different set of 15 items from the main text. Results for the ABDM are shown on the left panel, and results for the Q-diffusion model are shown on the right. Each column of dots shows the results for one person fold, and each cluster of five columns shows the results for all five person folds on one item, and each group of three items shows the results for all five person folds on one item fold.

