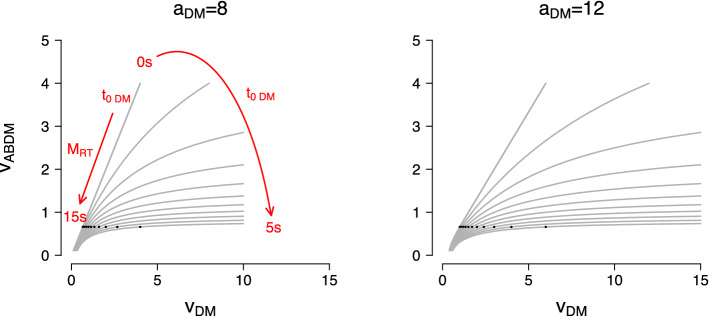
Fig. 8.
Relationship between parameters of the DM and the ABDM. Solid lines show how the drift rate in the ABDM, , relates to the drift rate in the DM, . Each grey line shows the relationship between the drift rate parameters of the two models for a fixed value of non-decision time in the classic DM. The left panel shows the results for a boundary separation value of in the classic DM; the right panel shows the results for . Small black dots show the drift rate values in each model that correspond to a mean response time of 6 s. Drift rates for the ABDM are shown for a diffusion coefficient of and ratio of boundary separation to drift rate of . The bias parameter in the classic DM was set to .

