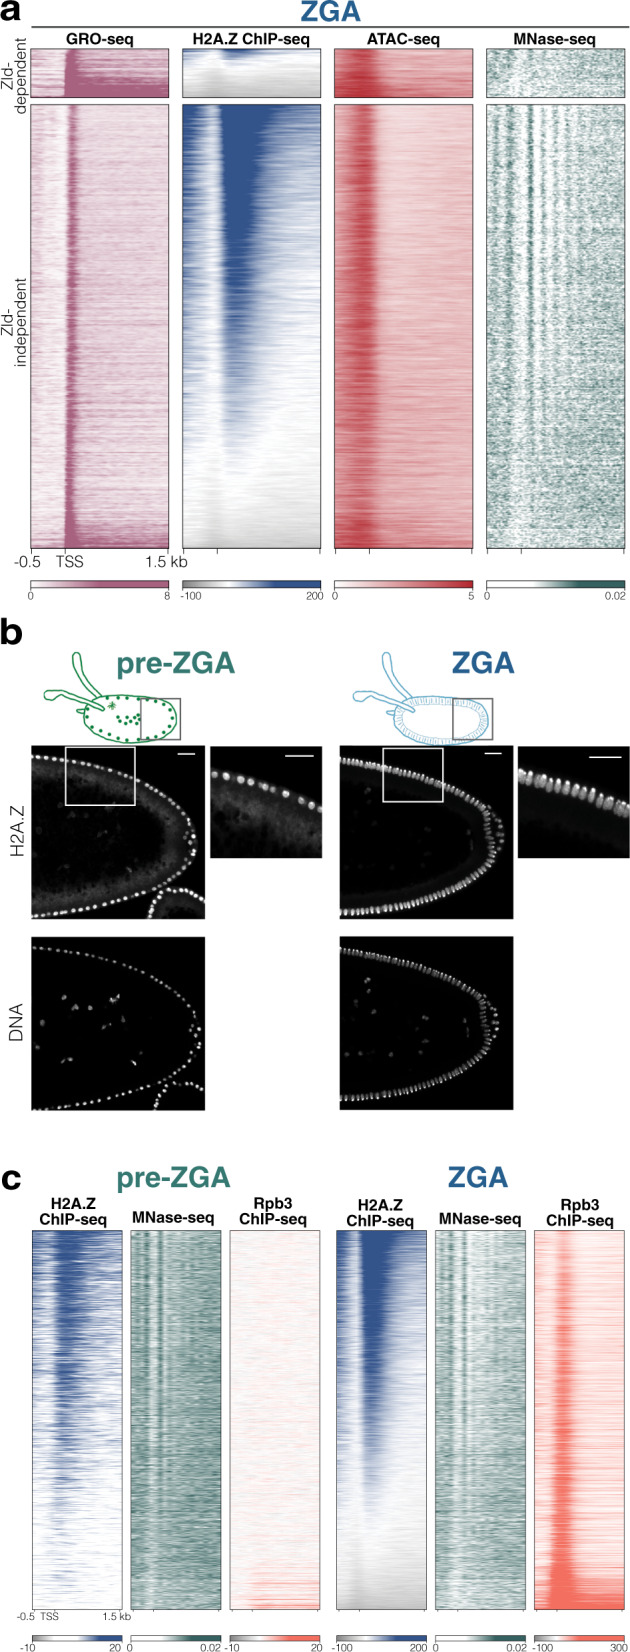
Fig. 1. H2A.Z marks most of active TSS at ZGA and its deposition precedes ZGA.

a Heatmap of active promoters at NC14 determined by GRO-seq signal, and classified as Zld-dependent and Zld-independent according to ref. 10. Sorting is based on H2A.Z signal and shows the distribution of H2A.Z (ChIP-seq), chromatin accessibility (ATAC-seq) and nucleosome positioning (MNase-seq) in these transcripts. Mean signal of three (GRO-seq) and two (H2A.Z ChIP-seq and ATAC-seq) replicates is shown. For MNase-seq, merged signal of three replicates from ref. 22 is shown (see Methods for details). See also Supplementary Fig. 1a, b. b Immunofluorescence of H2A.Z in pre-ZGA (left, NC11) and ZGA (right, NC14) embryos showing that H2A.Z localizes in the nucleus before and during ZGA. Insets show a magnification of the H2A.Z signal. Similar results were observed for at least 5 embryos of each stage. Scale bar = 20 μm. See also Supplementary Fig. 1e, f. c Heatmaps of transcripts with active promoters sorted by H2A.Z signal at ZGA. H2A.Z is already localized on chromatin before ZGA at NC9-12 (left, H2A.Z ChIP-seq) and nucleosomes are already positioned (left, MNase-seq), a lack of the Rpb3 signal (left) (Rpb3 ChIP-seq, representing RNA Pol II binding) confirms the pre-ZGA stage (see also Supplementary Fig. 1g, h). The same signal tracks are shown for embryos at ZGA for comparison (last 3 panels to the right). Mean signal of two replicates (H2A.Z and Rpb3 ChIP-seq) and merged signal of three replicates (MNase-seq, from ref. 22) are shown per track.
