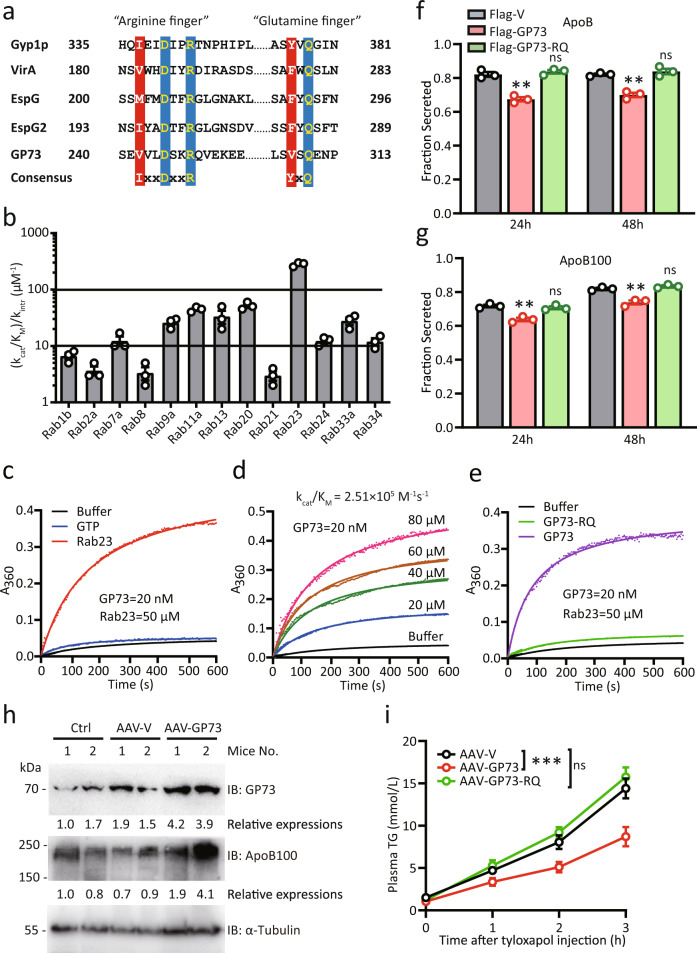
Fig. 1. GP73 harbors potent TBC-domain GAP activity that inhibits VLDLs’ secretion.
a Comparison of amino acid sequences around R248 and Q310 in GP73 and equivalent residues in Gyp1p, VirA, EspG, and EspG2 with dual-finger catalytic motifs in the TBC domain. b GAP activity profiles of GP73 for a panel of 13 mammalian Rabs. The catalytic efficiency (kcat/KM) of GP73-catalyzed GTP hydrolysis relative to the intrinsic GTP hydrolysis rate constant was determined for each Rab. n = 3 independent biological experiments. Data are presented as mean ± SEM. c, d Kinetic analysis of GP73 GAP activity toward Rab23. The kcat/KM determined by using a Lineweaver-Burk plot is listed above the activity curves. n = 3 independent biological experiments. e Effects of R248K and Q310A mutations in GP73 (GP73-RQ) on GP73 GAP activity. n = 3 independent biological experiments. f, g ApoB (f) and ApoB100 (g) secretion efficiency of Huh-7 cells transfected with Flag-vector (Flag-V), Flag-GP73, or Flag-GP73-RQ mutant at the indicated time points after transfection. Secretion efficiency was calculated as the fraction secreted, defined as the ratio between the amounts of cargo that was secreted and the total amount of cargo (secreted plus cell-associated cargo) present in a well. n = 3 independent biological experiments. Differences between the two groups were evaluated using two-tailed Student’s t-test. Data are presented as mean ± SEM. ns, no statistical significance; **P < 0.01. h GP73 and ApoB100 protein levels in mice livers at week 3 after the injection of AAV-V or AAV-GP73 (n = 2 per group). α-Tubulin was used as the equal loading control. Relative expression was calculated as the fold change in expression relative to the expression in No. 1 control mice. i TG concentrations at the indicated time points after blood sampling of AAV-V-, AAV-GP73-, or AAV-GP73-RQ-injected mice fasted for 4 h and then intravenously administered tyloxapol (400 mg/kg; n = 6 per group). Differences between the three groups were evaluated using two-way ANOVA and Bonferroni’s post hoc analysis. Data are presented as mean ± SEM. ns, no statistical significance; ***P < 0.001.

