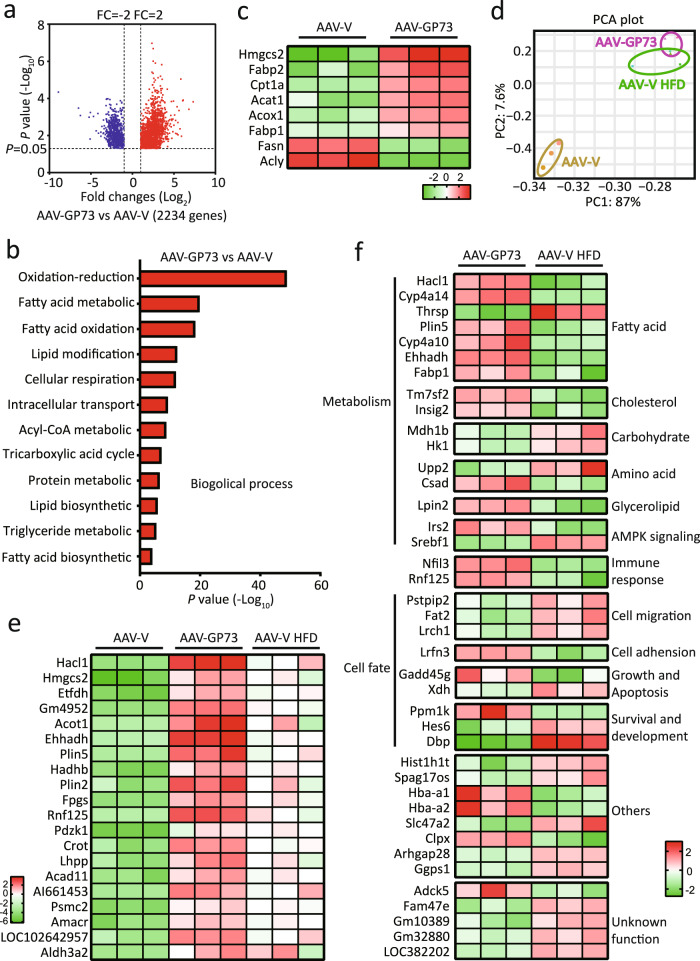
Fig. 4. Gene expression signatures in non-obese NAFLD induced by GP73.
a Volcano plot of the DEGs in the livers from AAV-GP73-injected mice fed a regular diet for 12 months (n = 3 per group). Significantly downregulated genes are in blue, and significantly upregulated genes are in red. The data were analyzed with two-sided Student’s t-test. The black vertical lines highlight fold changes (FCs) of −2 and 2, while the black horizontal line represents a P value of 0.05. b Pathways enriched for the DEGs in the livers from AAV-GP73-injected mice at 12 months after injection (n = 3 per group) according to GO term analysis at GO level 4. The bar plot shows significantly dysregulated pathways, and Fisher’s exact test P values are shown on the x-axis. c Heatmap of the critical DEGs in the livers from AAV-GP73-injected mice versus AAV-V-injected mice fed a regular diet for 12 months. Upregulated genes are highlighted in red, and downregulated genes are highlighted in green. d PCA results. PCA was based on the gene expression patterns in the AAV-V (yellow), AAV-GP73 (purple), and AAV-V HFD (green) groups. In all plots, each point represents a sample. e Heatmap of the top 20 highly upregulated genes in the livers from the AAV-GP73 and HFD groups. f Heatmap of the top 20 highly upregulated and 20 highly downregulated genes that were specifically regulated by GP73.

