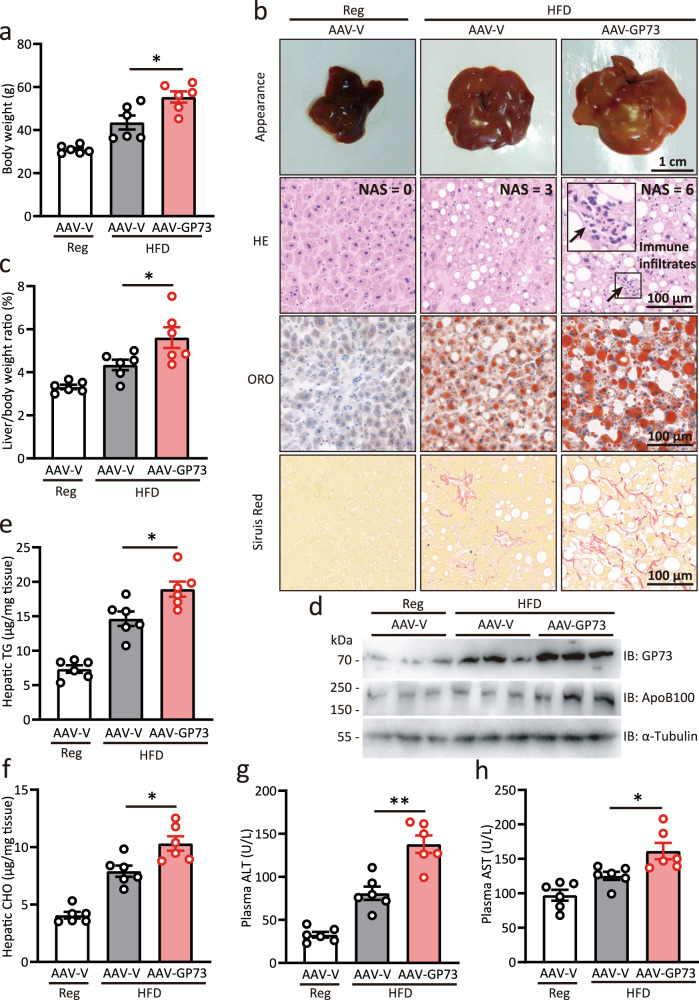
Fig. 5. GP73 promotes NASH progression in obese NAFLD induced by HFD.
a Body weights of AAV-V-injected mice fed a regular diet and AAV-V- or AAV-GP73-injected mice fed a HFD for 12 months (n = 6 per group). Differences between the three groups were evaluated using one-way ANOVA and Bonferroni’s post hoc analysis. Data are presented as mean ± SEM. *P < 0.05. b Appearance, HE, ORO, and Sirius red staining of the livers from AAV-V-injected mice fed a regular diet and AAV-V- or AAV-GP73-injected mice fed a HFD for 12 months (n = 6 per group). c Liver-to-body weight ratio of AAV-V-injected mice fed a regular diet and AAV-V- or AAV-GP73-injected mice fed a HFD for 12 months (n = 6 per group). Differences between the three groups were evaluated using one-way ANOVA and Bonferroni’s post hoc analysis. Data are presented as mean ± SEM. *P < 0.05. d GP73 and ApoB100 protein levels in livers from AAV-V-injected mice fed a regular diet and AAV-V- or AAV-GP73-injected mice fed a HFD for 12 months (n = 3 per group). α-Tubulin was used as the equal loading control. Relative expression was calculated as the fold change in expression relative to the expression in No. 1 control mice. e–h Hepatic levels of TGs (e) and CHO (f); plasma levels of ALT (g), and AST (h) in AAV-V-injected mice fed a regular diet and AAV-V- or AAV-GP73-injected mice fed a HFD for 12 months (n = 6 per group). Differences between the three groups were evaluated using one-way ANOVA and Bonferroni’s post hoc analysis. Data are presented as mean ± SEM. *P < 0.05; **P < 0.01.

