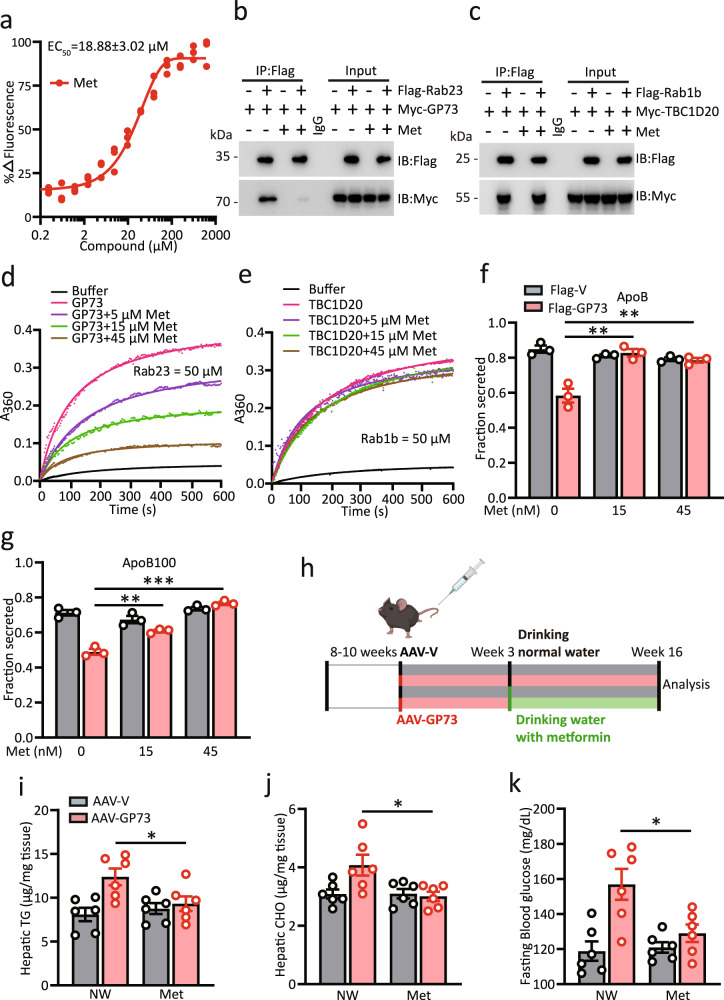
Fig. 6. Metformin alleviates non-obese NAFLD induced by GP73.
a Microscale thermophoresis (MST) analysis of the interaction between metformin (Met) and GP73. The data were derived from the effect of metformin on the fluorescence decay of fluorescently labeled GP73. The half-maximum effective concentration (EC50) was determined by the Hill slope. n = 3 independent biological experiments. b, c Immunoprecipitation analysis of the interaction between GP73 and Rab23 (b) or TBC1D20 and Rab1b (c) in the presence or absence of Met. Data were repeated three times with similar results. d, e Kinetic analysis of GP73 activity toward Rab23 (d) or TBC1D20 activity toward Rab1b (e) in the presence of different concentrations of Met. n = 3 independent biological experiments. f, g ApoB (f) and ApoB100 (g) secretion efficiency in cells from Flag-vector- or Flag-GP73-transfected cells treated with Met. n = 3 independent biological experiments. Differences between the two groups were evaluated using one-way ANOVA and Bonferroni’s post hoc analysis. Data are presented as mean ± SEM. **P < 0.01; ***P < 0.001. h Schematic depicting the experimental setup. i–k Hepatic levels of TGs (i) and CHO (j); 6 h-fasted glucose levels (k) of AAV-V- or AAV-GP73-treated mice given normal drinking water (NW) or drinking water with metformin (3 g/L) (NW) for 4 months (n = 6 per group). Differences between the four groups were evaluated using one-way ANOVA and Bonferroni’s post hoc analysis. Data are presented as mean ± SEM. *P < 0.05.

