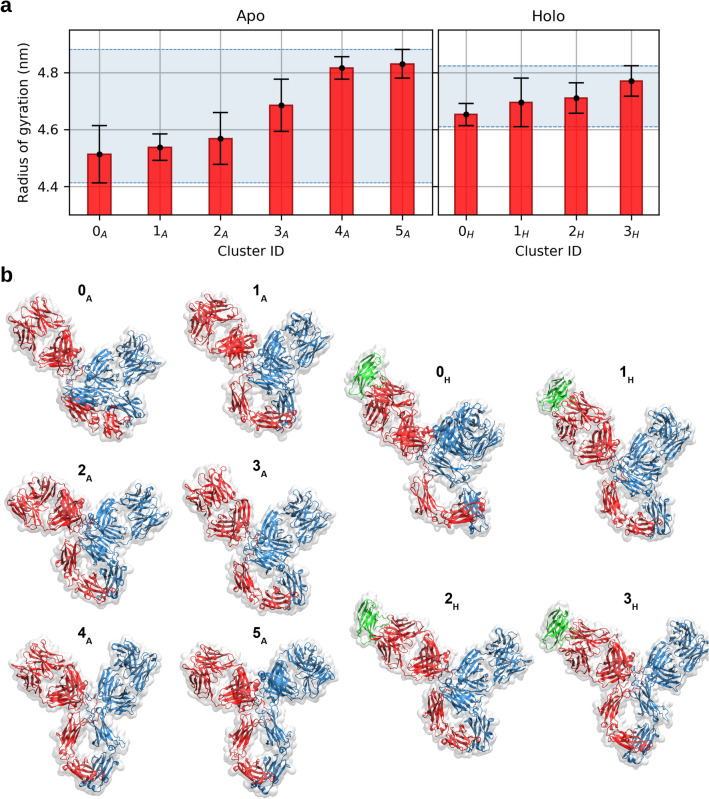
Figure 2.
(a) Mean and standard deviation of the antibody radii of gyration in the apo forms (left) and holo forms (right), averaged within each conformational cluster. In the holo case, the radius is computed for the antibody alone. The error bars correspond to the standard deviation within each cluster. The shaded areas correspond to the range of variability, which is greatly reduced in the holo case. (b) Representative structures of pembrolizumab in the apo (A) and holo (H) forms, for each conformational cluster. Chains AB are in blue, chains CD in red, and the antigen PD-1 in green.

