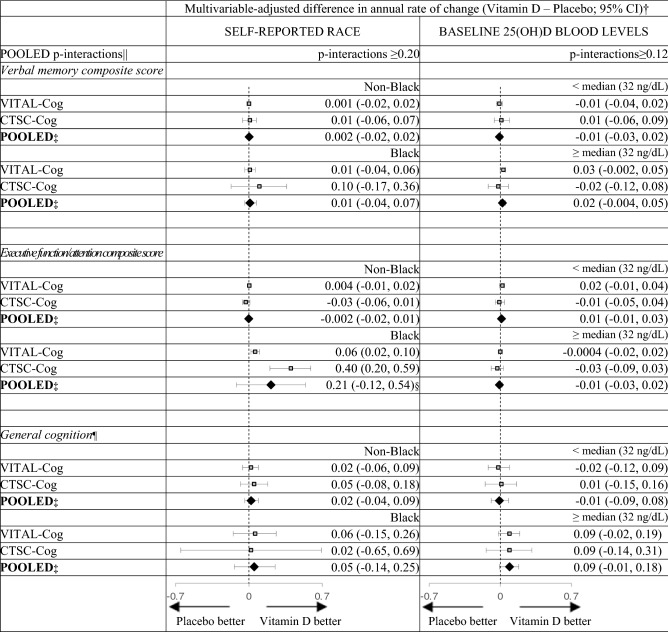
Table 5.
Pooled results across VITAL-Cog and CTSC-Cog for mean difference in annual rate for the secondary outcomes for vitamin D-Placebo: effect modification by race and blood 25(OH)D levels for cognitive decline.
3MS Modified Mini-Mental Status exam (range = 0–100)33; CI confidence interval; CTSC Clinical and Translational Science Collaborative center for VITAL in Boston, MA; TICS Telephone Interview of Cognitive Status (range = 0–41)37.
For definitions of the secondary outcomes for the two populations, see footnotes for Table 2.
aFrom multivariable-adjusted linear mixed models of cognitive performance (model 2) as described in footnote in Table 3.
bPooled using Dersimonian and Laird fixed-effects method for meta-analysis40 unless otherwise noted.
cPooled using Dersimonian and Laird random-effects method for meta-analysis40 as the p for heterogeneity was 0.001; if fixed effects methods are used, the pooled estimate was 0.07 (95% CI 0.03, 0.12).
dNot significant at Bonferroni-corrected p-value of 0.0167 (= 0.05/3 outcomes).
eDue to the differences in scale between the TICS (0–41) used in VITAL-Cog and 3MS (range 0–100) used in CTSC-Cog, for pooling purposes, the 3MS scores were multiplied by 0.41 for conversion to the same scale as the TICS scores.

