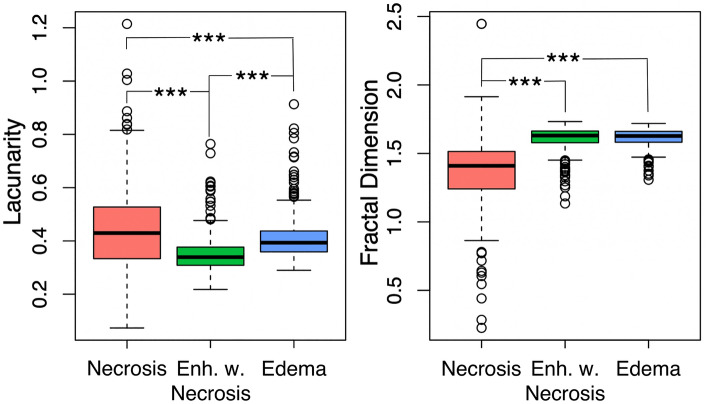
Figure 6.
Significant differences in lacunarity and fractal dimension between regions of interest. (Left) We note significant differences in lacunarity values across all three regions of interest, with necrosis the highest, followed by edema, followed by enhancement with necrosis (all comparisons p < 0.001). (Right) Fractal dimension values are significantly higher in edema and enhancement with necrosis when compared with necrosis (p < 0.001), but we did not observe significant differences in fractal dimension between edema and enhancement with necrosis (p = 0.49).

