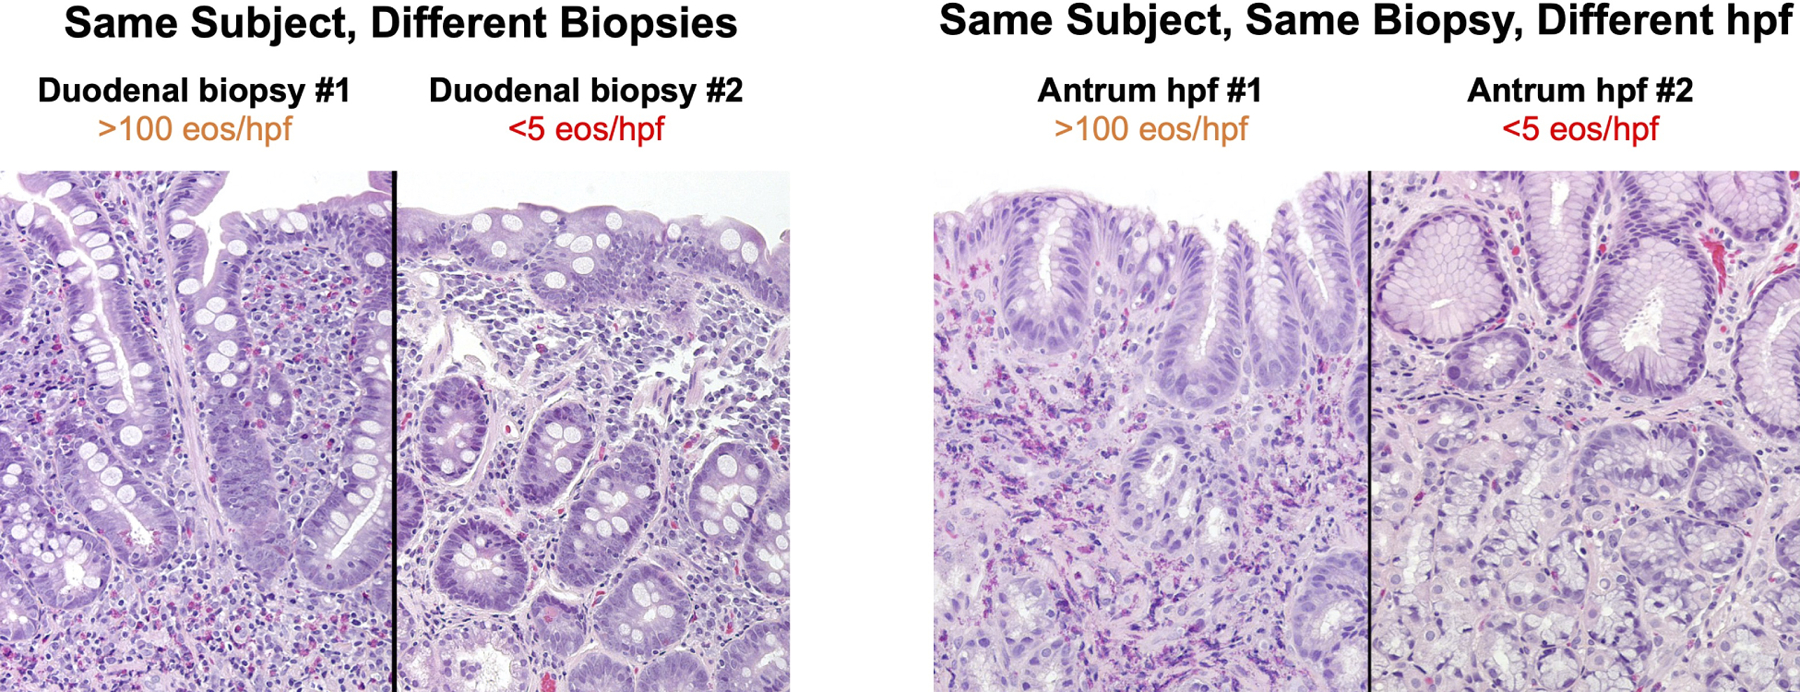
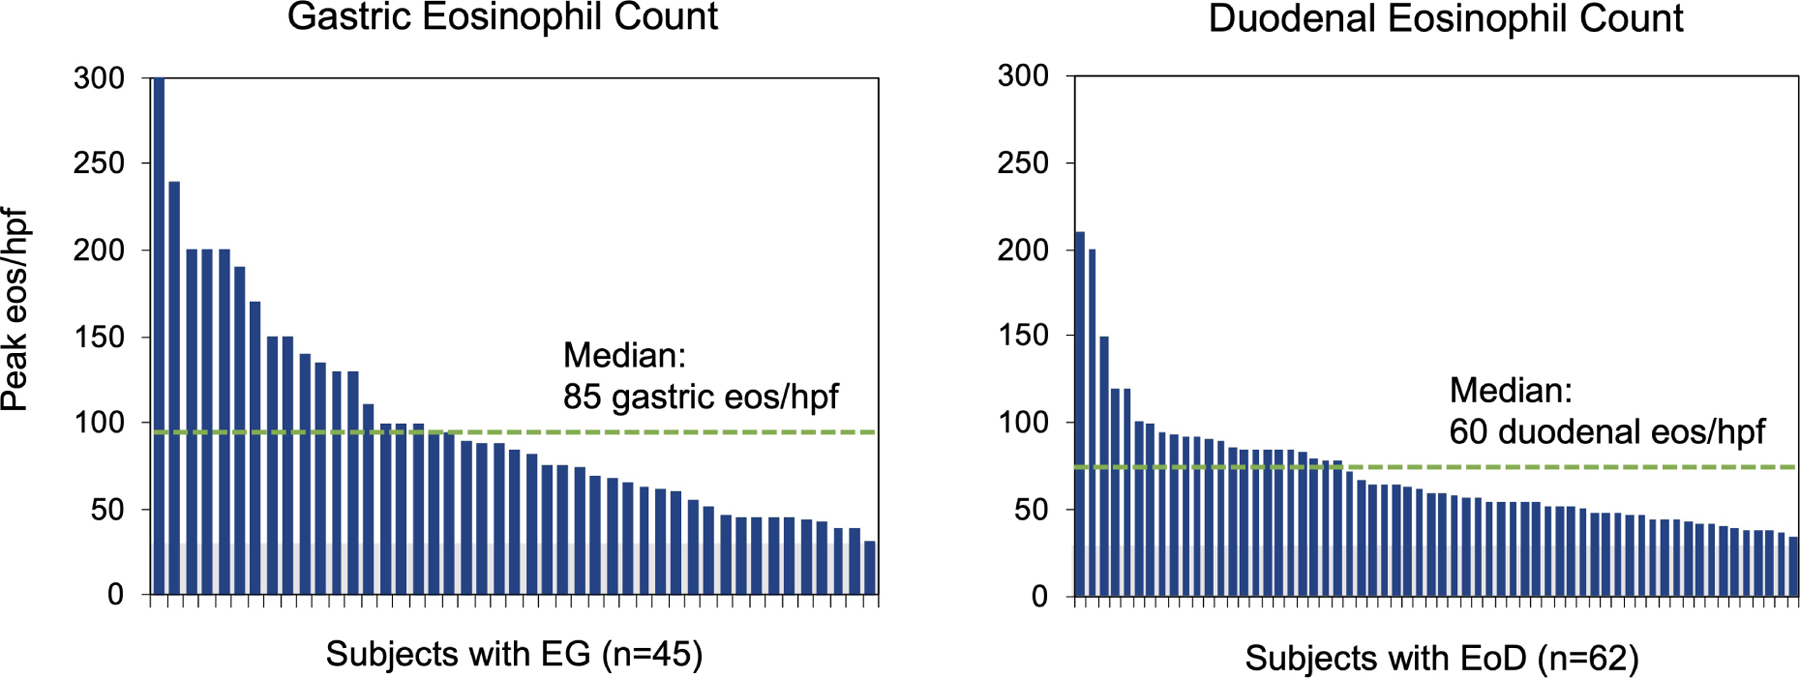
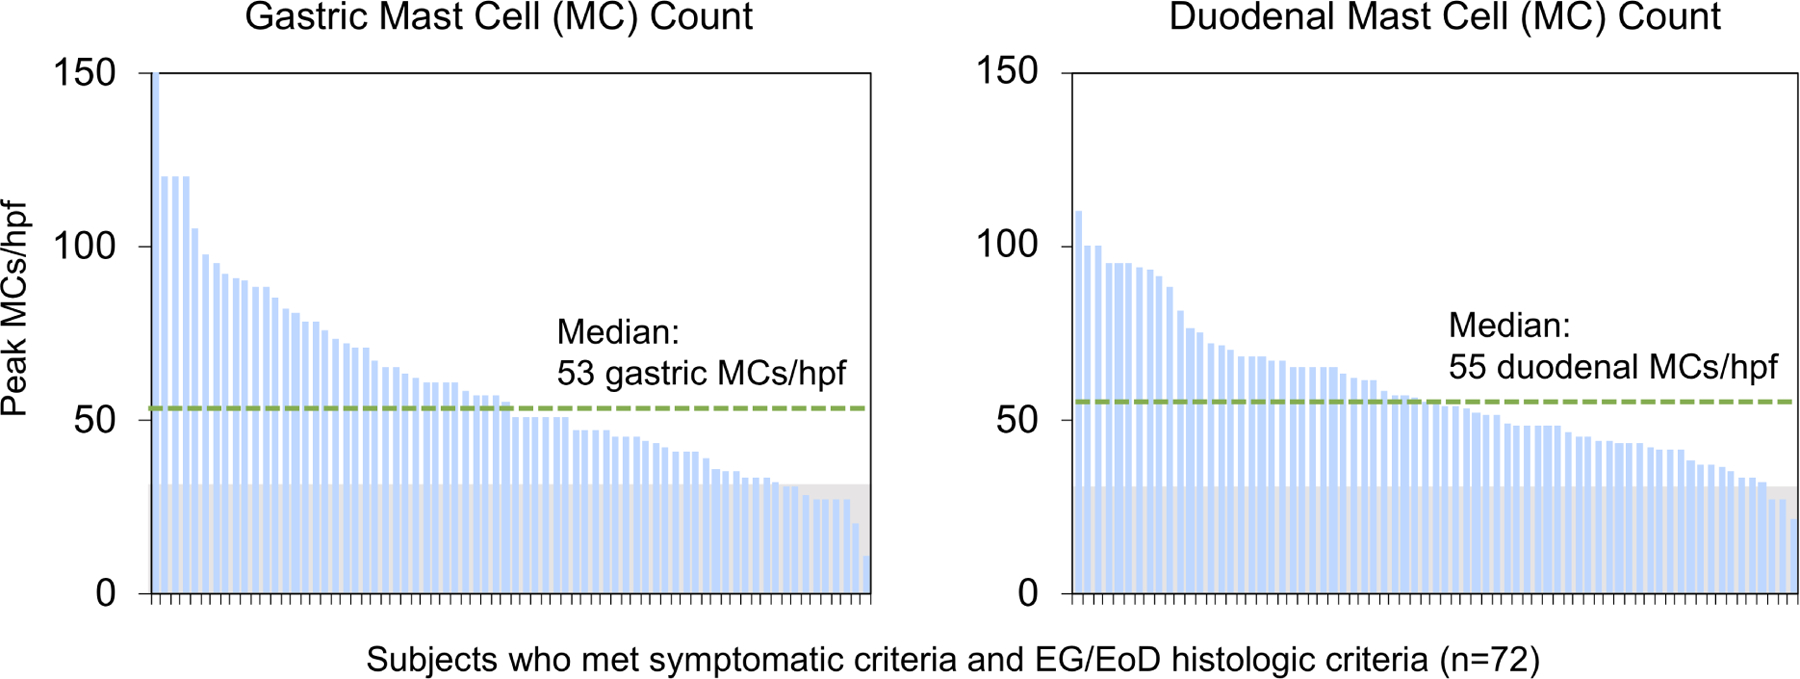
Figure 3. Histologic Features.


(A) High-power (20X) images of EG/EoD specimens showing patchiness of eosinophils in different biopsies from the same subject (left) and among different hpfs from the same biopsy (right). (B) Peak number of gastric (left) and duodenal (right) eos/hpf in subjects with EG and EoD. Green dotted line indicates median peak eos/hpf. (C) Peak gastric (left) and duodenal (right) mast cell (MC) counts in subjects who met histologic criteria for EG/EoD. The histologic criteria for elevated MCs is ≥30 MCs/hpf (above gray area)(29, 31–34); green dotted line indicates median peak MCs/hpf in patients with EG/EoD.
