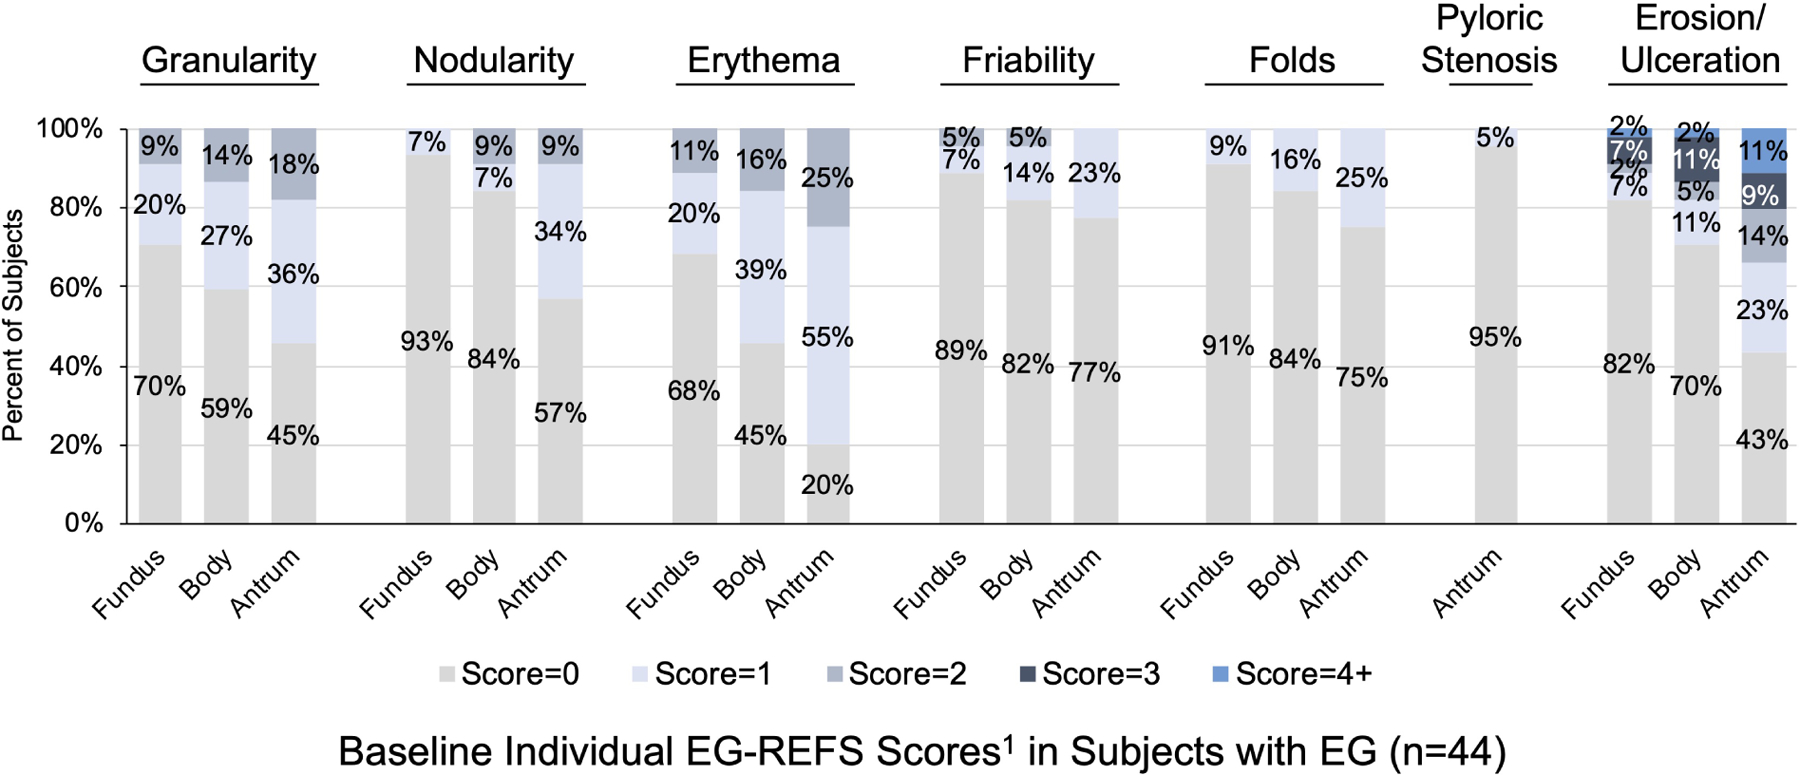
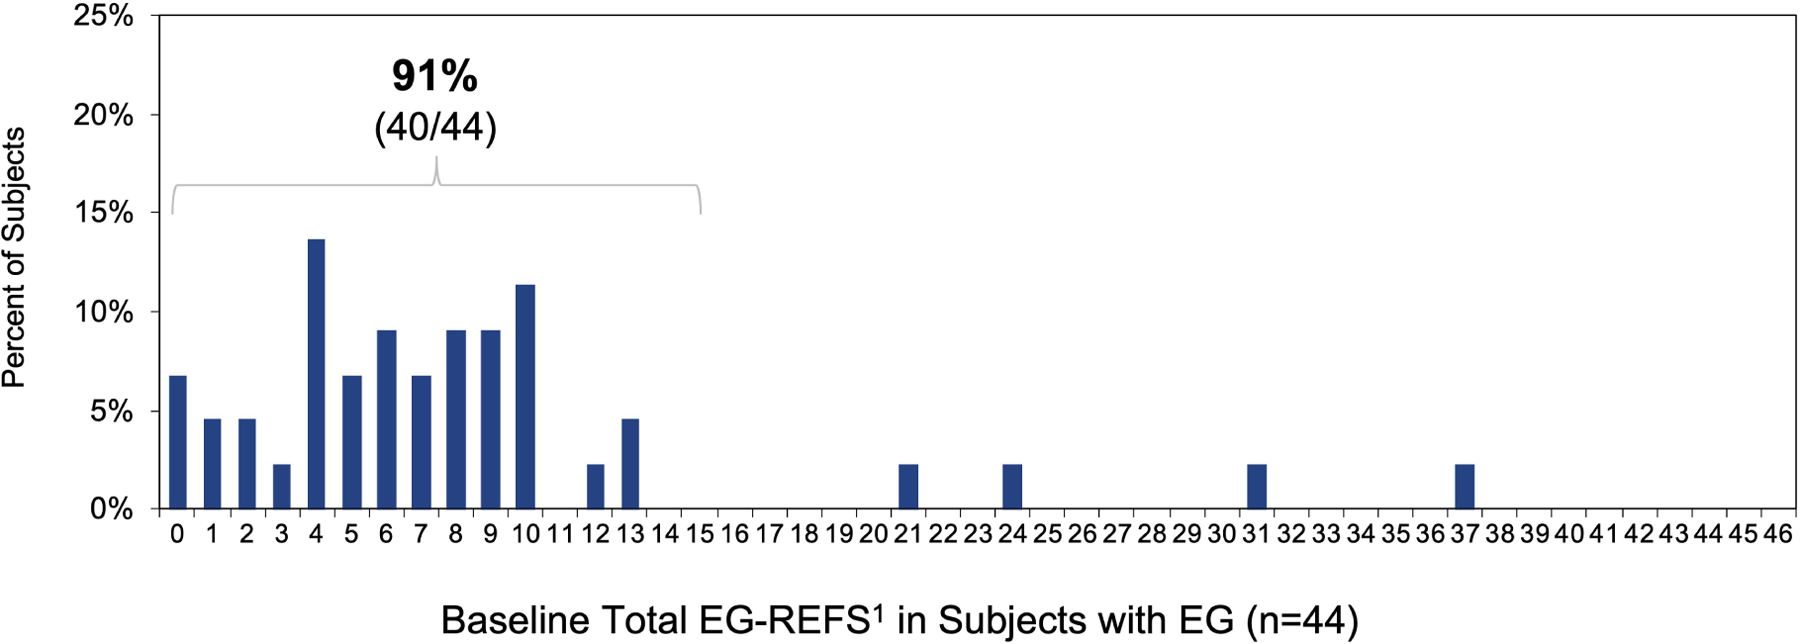
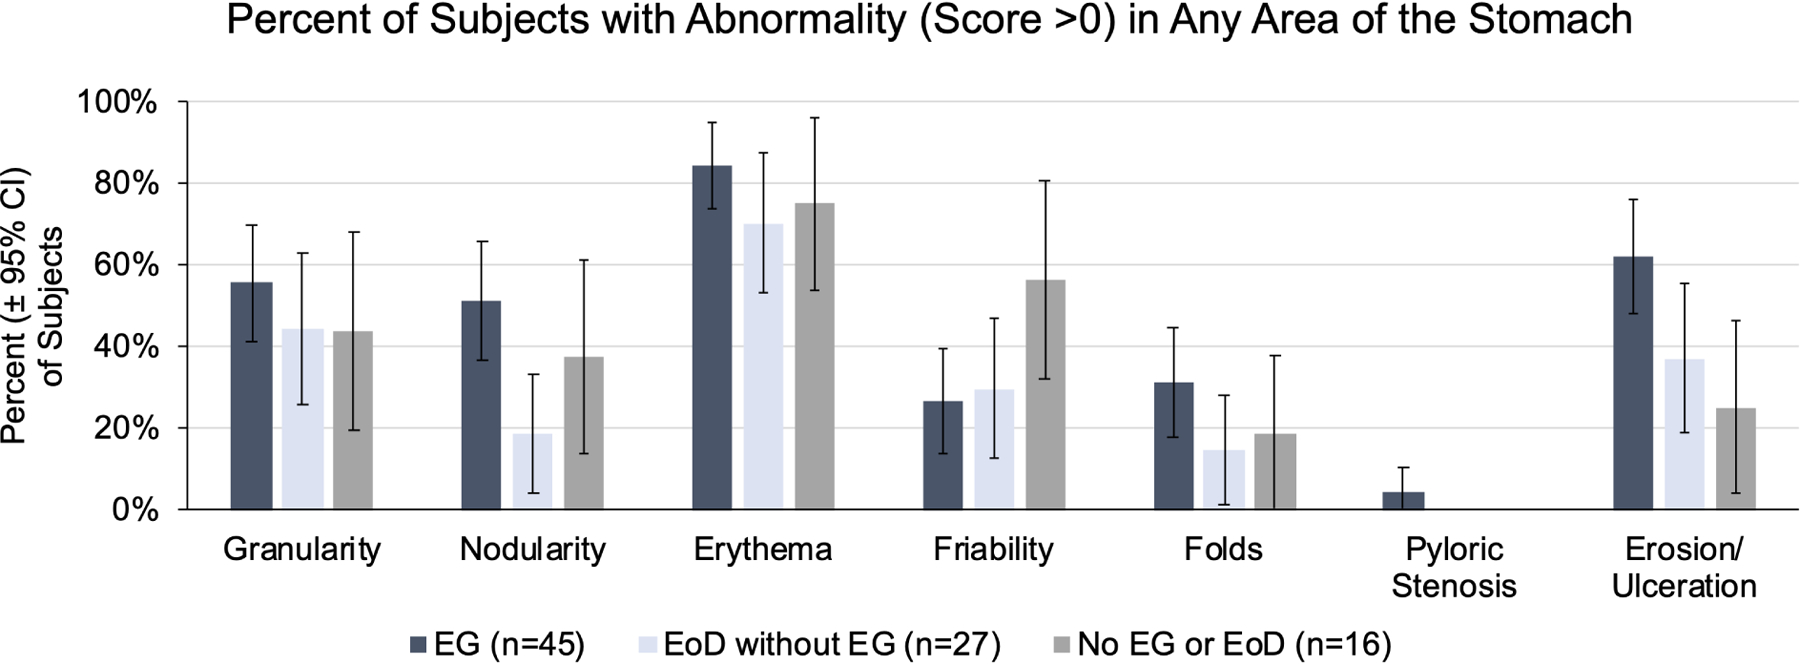
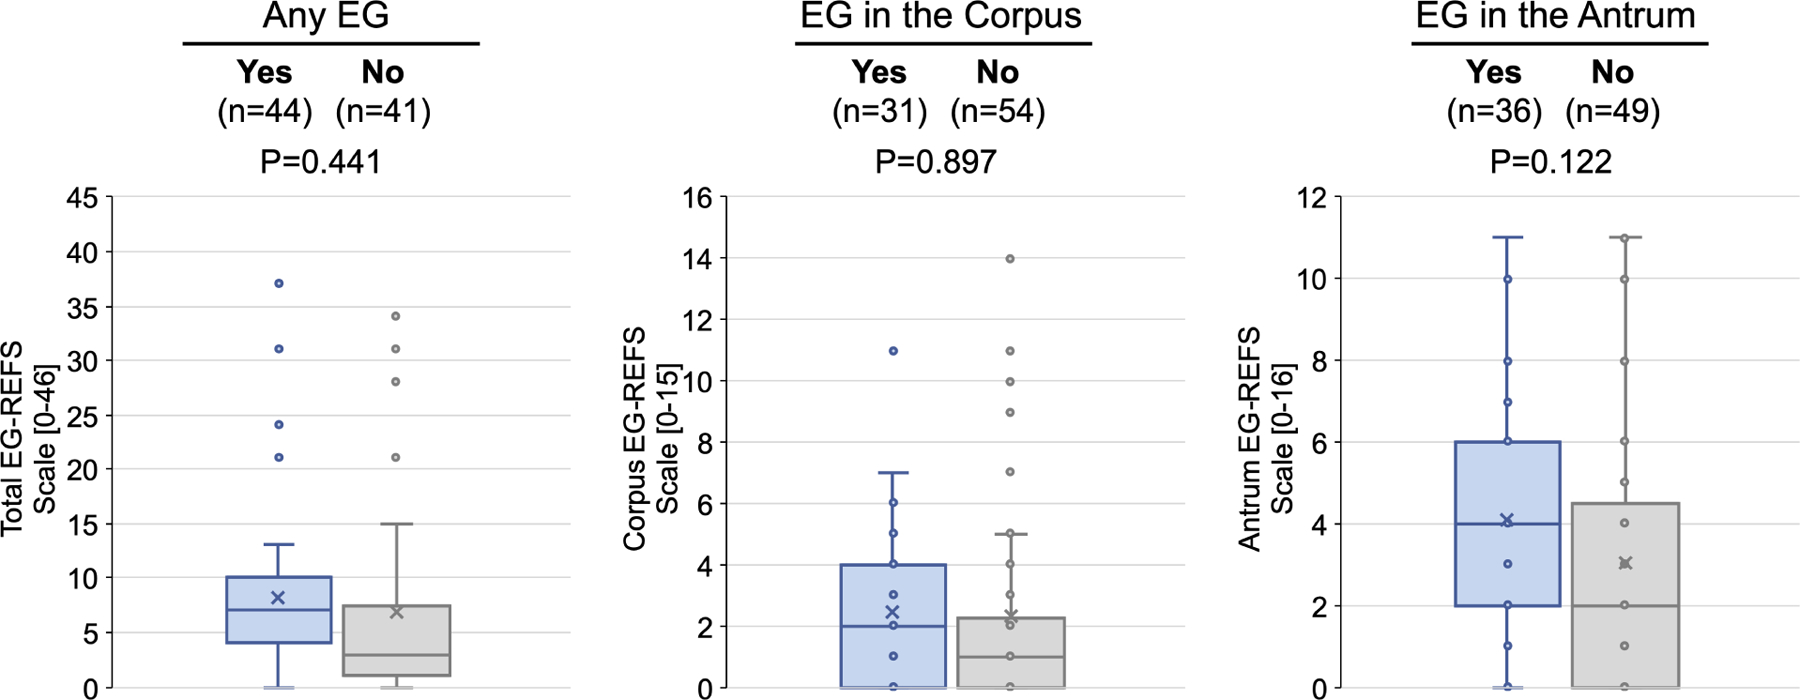
Figure 4. Endoscopic Appearance.


(A) Percent of EG subjects with each EG-REFS score (0= normal and 1=mild). (B) Percent of subjects with each EG-REFS. (C) Percent of subjects with endoscopic abnormalities (EG-REFS >0) in any area of stomach. (D) Box and whisker plot (Tukey method) of subjects with (blue) and without (gray) histologic EG. No EG indicates subjects who did not meet histologic criteria for EG or EoD (n=15) or who met histologic criteria for only EoD (n=26). One subject from the EG group and 2 from the No EG group were not assessed by EG-REFS at screening and are not included in analysis. P value calculated by 2-sample t test.
