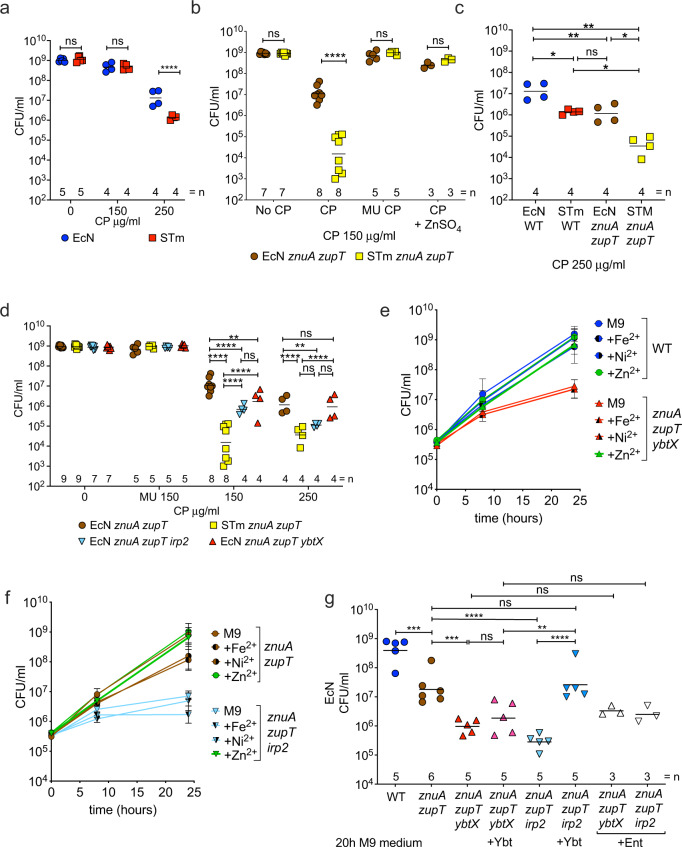
Fig. 1. E. coli Nissle resistance to calprotectin-mediated zinc limitation in vitro is dependent on ZnuABC, ZupT, and yersiniabactin.
a E. coli Nissle (EcN) and S. Typhimurium (STm) wild-type were grown in modified LB medium without calprotectin (CP), or supplemented with 150 µg/ml or 250 µg/ml CP. Statistics: two-way ANOVA with Šidák’s multiple comparisons test. b EcN and STm znuA zupT mutants were grown in modified LB medium without CP (No CP), or supplemented with 150 µg/ml CP, 150 µg/ml Site I/II knockout mutant CP (MU CP), or 150 µg/ml CP plus 5 µM ZnSO4 (CP + ZnSO4). Statistics: two-way ANOVA with Šidák’s multiple comparison test. c EcN and STm wild-type and znuA zupT mutants were grown in modified LB medium supplemented with 250 µg/ml CP. Statistics: one-way ANOVA with Tukey’s multiple comparisons test. d EcN and STm znuA zupT mutants, as well as EcN triple mutants (znuA zupT irp2; znuA zupT ybtX), were grown in modified LB without CP, or supplemented with either 150 µg/ml mutant CP (MU 150), or with 150 µg/ml (150) or 250 µg/ml CP (250). Statistics: two-way ANOVA with Tukey’s multiple comparisons test. e, f EcN wild-type, double (znuA zupT) and triple (znuA zupT irp2; znuA zupT ybtX) mutants were grown in M9 medium (n = 3 biologically independent replicates) or in M9 supplemented with either 5 µM ZnSO4 (n = 3 biologically independent replicates), 5 µM FeCl2 (n = 5 biologically independent replicates), or 5 µM NiCl2 (n = 5 biologically independent replicates). g EcN wild-type and indicated double and triple mutants were grown in M9 medium or in M9 supplemented with either 1 µM yersiniabactin (Ybt) or enterobactin (Ent). Statistics: one-way ANOVA with Tukey’s multiple comparisons test. a–g Growth was quantified by enumeration of bacterial CFU on selective media after a–d 16 h static, e, f 8 h and 24 h shaking, or g 20 h shaking incubation. Data are representative of three independent experiments. a–d, g Bars represent the geometric mean. The number (=n) of biologically independent replicates for each group is indicated in each figure panel. e, f Data are presented as geometric mean values ± geometric SD. *P value ≤ 0.05; **P value ≤ 0.01; ***P value ≤ 0.001, ****P value ≤ 0.0001; ns not significant. Exact P values are reported in Supplementary Data 2. Source data are provided as a Source Data file.

