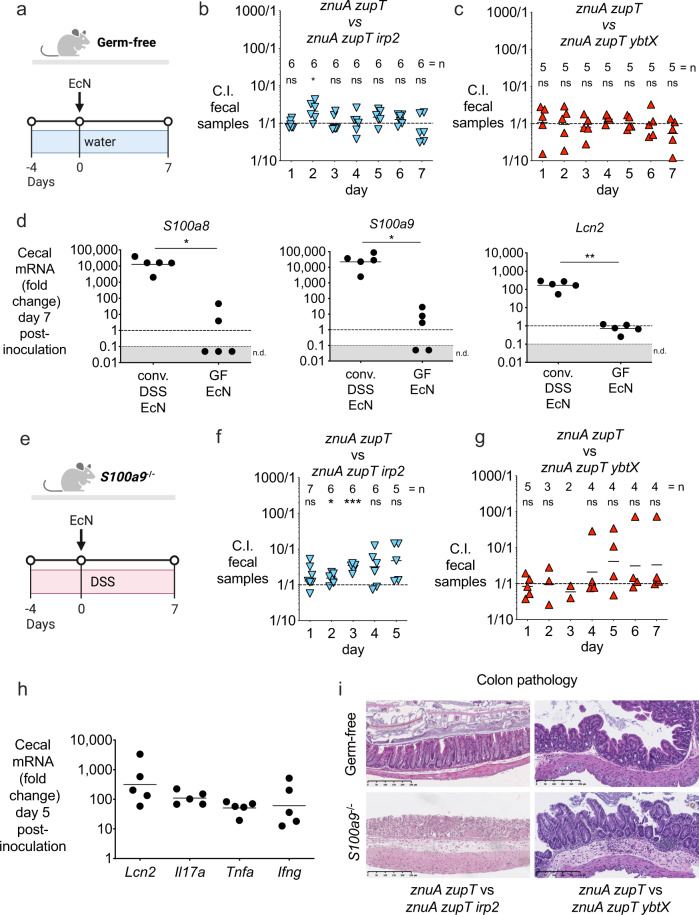
Fig. 5. Yersiniabactin-mediated zinc acquisition provides a competitive advantage for E. coli Nissle in the presence of inflammation and calprotectin.
a Experiment timeline for panels b and c. b, c Female Germ-free Swiss Webster mice were colonized with 1×10⁹ CFU of a 1:1 mixture of b EcN znuA zupT and znuA zupT irp2 (mice were 21 weeks of age) or c EcN znuA zupT and znuA zupT ybtX (mice were 30 weeks of age). Fecal samples were collected daily and the competitive index (C.I.) was calculated by dividing the output ratio (CFU of EcN znuA zupT / CFU of the respective EcN triple mutant) by the CFU-enumerated input ratio of the strains. Two-sided one-sample t test was used on log-transformed data to accept or reject null hypothesis (theoretical mean = 0). d mRNA expression of S100a8, S100a9, and Lcn2 was measured in the cecum of mice in panel c (n = 5 biologically independent samples); conventional DSS-treated mice colonized with EcN were used as a control (n = 5 biologically independent samples). Each circle represents a biologically independent sample, and bars represent the geometric mean. Unpaired two-tailed t test was used. e Experiment timeline for panels f and g. f, g Male and female S100a9-/- mice were given 4% (w/v) DSS in the drinking water for 4 days (day −4 to 0). On day 0, mice were orally gavaged with 1 × 10⁹ CFU of a 1:1 mixture of f EcN znuA zupT and znuA zupT irp2 (mice were 9–10 weeks of age) or g EcN znuA zupT and znuA zupT ybtX (mice were 16–30 weeks of age). Fecal samples were collected daily and the C.I. was calculated as described for panel b strains. Two-sided one-sample t test was used on log-transformed data to accept or reject null hypothesis (theoretical mean = 0). b, c, f, g Each data point represents a single mouse (biologically independent samples), and bars represent the geometric mean. The number (=n) of biologically independent replicates for each group is indicated in each figure panel. h mRNA expression of Lcn2, Il17a, Tnfa, and Ifng was measured in the cecum of mice in panel f. Each circle (n = 5) represents a biologically independent sample, and bars represent the geometric mean. i Representative stained sections (H&E, original magnification ×10, scale bars represent 250 μm) of colon from germ-free mice, or DSS-treated S100a9−/− mice, 5–7 days post-administration of different groups of EcN (germ-free EcN znuA zupT vs znuA zupT irp2, n = 6; germ-free EcN znuA zupT vs znuA zupT ybtX, n = 5; S100a9−/− mice EcN znuA zupT vs znuA zupT irp2, n = 6; S100a9−/− mice EcN znuA zupT vs znuA zupT ybtX, n = 5; all colon samples are biologically independent). *P value ≤ 0.05; **P value ≤ 0.01; ***P value ≤ 0.001, ns not significant. Exact P values are reported in Supplementary Data 2. Source data are provided as a Source Data file.

