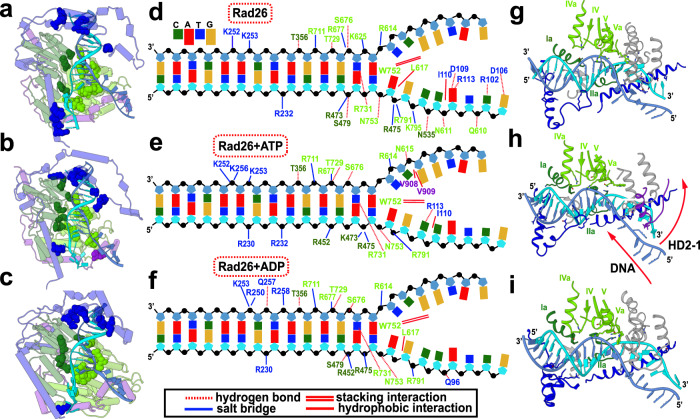
Fig. 3. Nucleotide binding alters Rad26–DNA interactions.
(a–c) Rad26 with highlighted Rad26–DNA contacts in (a), apo state; (b), ATP state; (c), ADP state. Rad26 is shown in cylindrical representation and colored by domains. The side chains of residues participating in DNA binding are shown as spheres and colored by domain—NTD in blue, RecA1 in dark green, RecA2 in light green and CTD in purple. (d–f), Schematic detailing the persistent contacts between Rad26 and DNA in (d), apo state; (e), ATP state; (f), ADP state. Residue labels are colored by domain. DNA phosphate groups are shown as black spheres. (g–i) Primary Rad26–DNA interactions in (g), apo state; (h), ATP state; (i), ADP state. Location of ATPase motifs on RecA1 and RecA2 are shown in dark green and light green, respectively.

