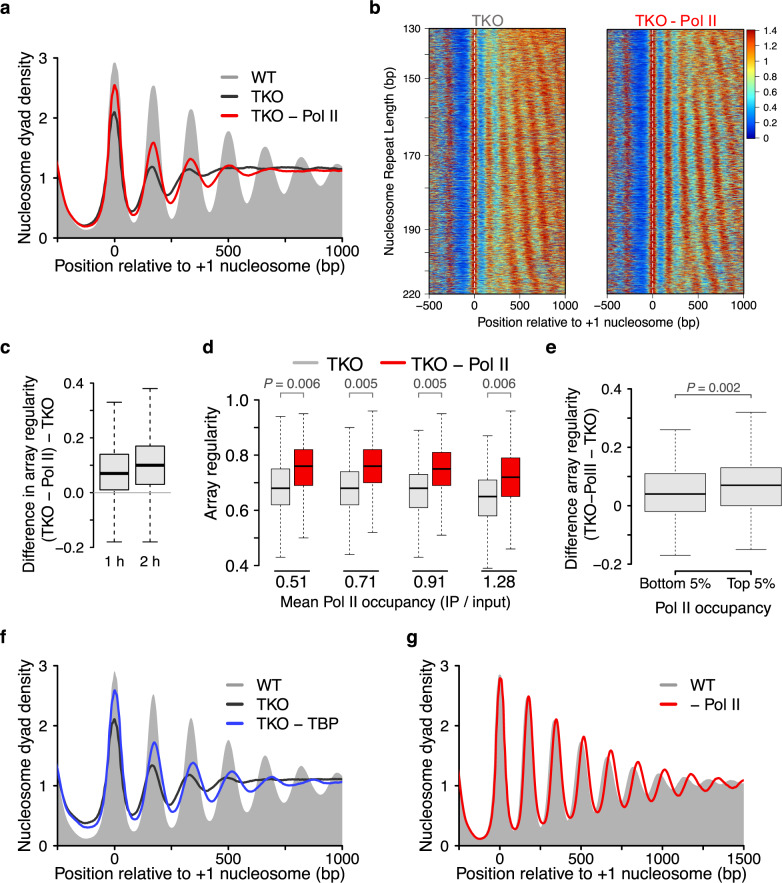
Fig. 2. Transcription disrupts the regularity of nucleosome arrays.
a Pol II depletion in TKO cells using anchor-away technology elevates levels of regular nucleosome arrays (red) compared to a TKO control strain (black). A WT control strain is shown for reference (grey). Rpb1 is FRB-tagged in all strains. Cells were either rapamycin-treated or mock-treated with vehicle for 1 h. b Heatmaps for data from a. Genes were sorted according to the NRL observed in TKO cells. Color scale represents nucleosome dyad density. c Most genes acquire a higher degree of array regularity after Pol II depletion in TKO cells. Shown is the difference in array regularity for each gene before and after Pol II depletion for 1 and 2 h. Boxplot represent array regularity calculated on pooled data (three replicates for 1 h and one replicate for 2 h depletion). d Array regularity is rescued upon Pol II depletion irrespective of the transcriptional strength of genes. Genes were sorted by Pol II occupancy and divided into quartiles. Mean Pol II occupancy values of each quartile can be found underneath. Pol II occupancy data for an isw1Δ, chd1Δ double mutant strain served as a proxy for TKO cells10. Similar results were obtained when genes were sorted by gene expression56. Statistical analysis represents linear mixed-effect model fitted on mean array regularity values of two replicates. e Change in array regularity upon Pol II depletion in TKO cells in genes with top and bottom 5% Pol II occupancy. P-value (P) represent statistical analyses performed with two-tailed Welch’s t-test on the mean values of three replicates. f Same as a, but for TBP depletion (1 h) in TKO cells. g Nucleosome organization upon Pol II depletion (1 h) in WT cells. Central lines in box plots indicate the median, the box shows the interquartile range, and whiskers indicate data points within 1.5× of the interquartile range.

