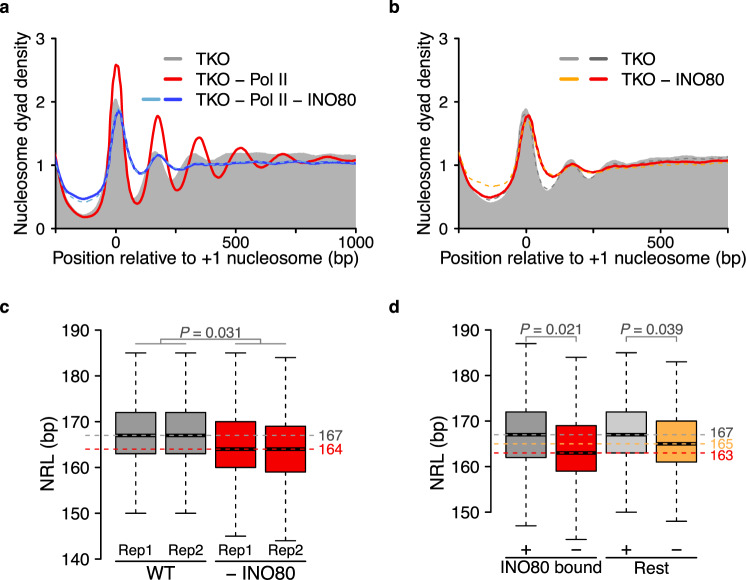
Fig. 3. INO80 induces nucleosome array formation in vivo.
a Nucleosome organization for the indicated Pol II anchor-away strains. Samples were treated with vehicle (TKO) or rapamycin (all other samples) for 2 h, twice as long as in Fig. 2. The treatment regimen allowed for efficient depletion, as tested by live cell imaging of GFP-tagged INO80 and Rbp3 ChIP-qPCR (Supplementary Figs. 2a and 4a). Dashed line: biological replicate. b Nucleosome organization upon INO80 depletion (1.5 h) in TKO cells (red and orange). Ino80-GFP-FRB tagged TKO cells treated with vehicle served as the reference (grey). Live cell imaging confirmed INO80 depletion (Supplementary Fig. 4d). c NRL distribution before and after INO80 depletion (1.5 h) in WT cells. Median values are indicated with horizontal dashed lines. d NRLs of 1646 genes bound by INO80, as measured by ChEC-seq3. Bound genes have median value (red dashed line) that is 2 bp shorter of that of all other genes (orange dashed line) after depletion. P-values (P) in c, d represent statistical analyses performed with two-tailed Welch’s t-test on the mean values of two replicates. Central lines in box plots indicate the median, the box shows the interquartile range, and whiskers indicate data points within 1.5 times of the interquartile range.

