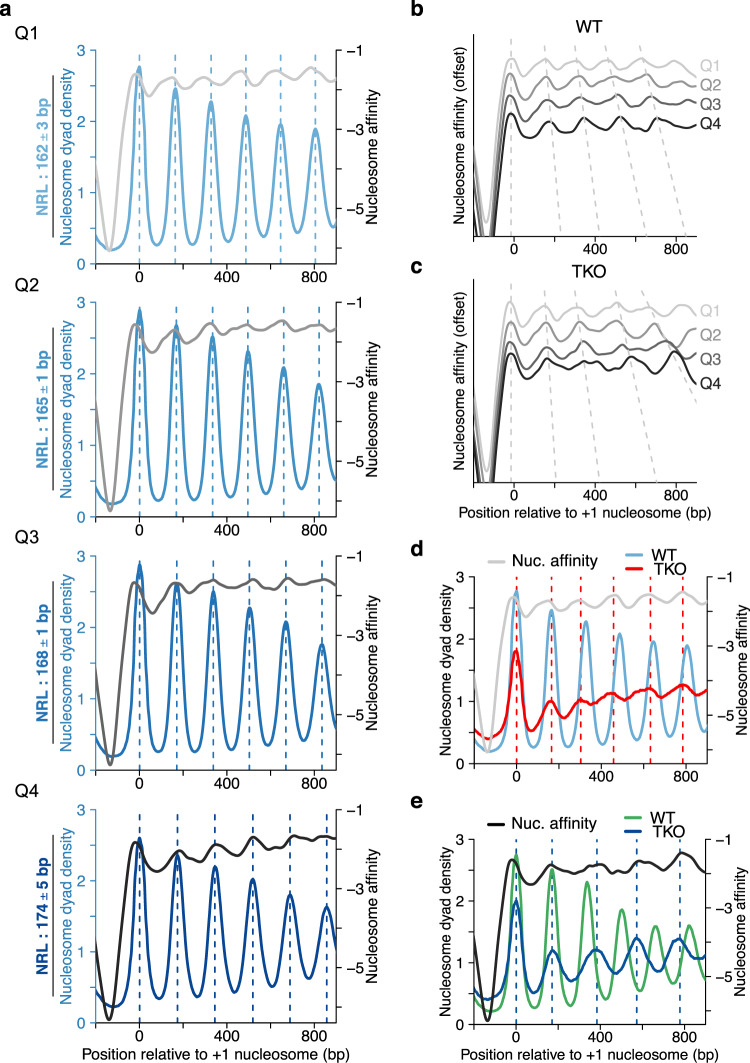
Fig. 6. DNA sequence contributes to NRL determination.
a Comparison of gene-averaged MNase-seq data and calculated nucleosome affinities for WT cells. Genes were filtered (see “Methods” section), sorted by NRL and grouped into quartiles from Q1 (shortest) to Q4 (longest NRL). NRL values are mean NRLs and their SD. Nucleosome affinities were calculated using nuCpos48. b, c Nucleosome affinities for Q1–Q4 of WT (b; replotted from a or TKO cells (c). d Arrays in Q1 of WT cells assume a shorter NRL in TKO cells. This shorter NRL is more similar to the NRL predicted from nucleosome affinities. e The NRL of arrays in Q4 of TKO cells is broadly consistent with the NRL predicted from nucleosome affinities. The same genes assume a substantially shorter NRL in WT cells, with peaks in the WT MNase-seq data straying further away from the thermodynamically most stable positions.

