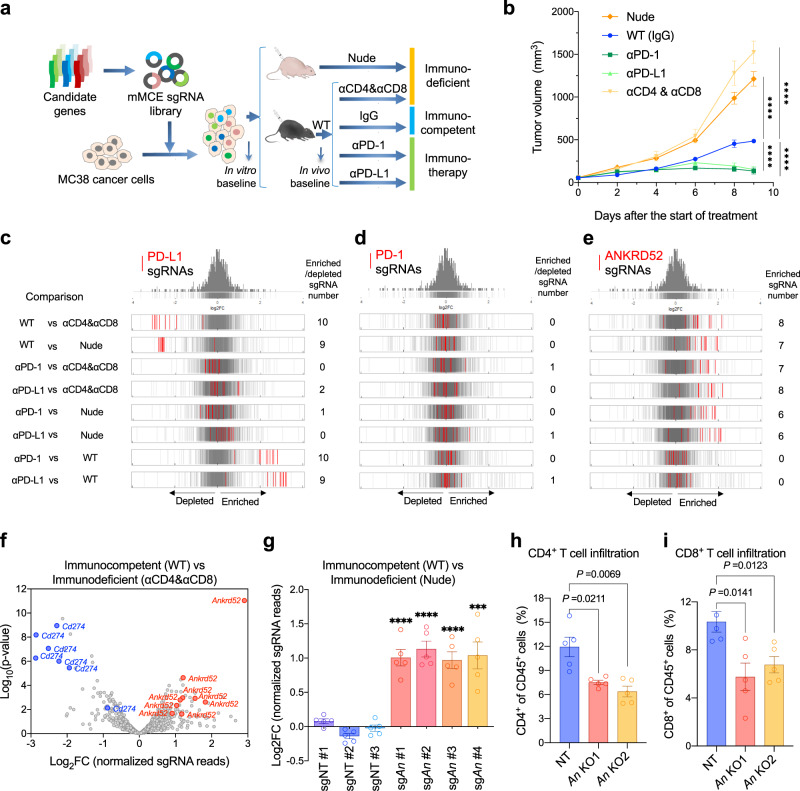
Fig. 2. In vivo CRISPR screen targeting profiled mutations identifies ANKRD52 as a key modulator of cancer immunity.
a Schematic overview of in vivo CRISPR screen to validate candidates from immune-selected mutations. b Tumor growth curves of MC38 tumors in nude mice (n = 8), and WT mice treated with rat IgG2a and IgG2b isotype (n = 8), PD-1 antibody (n = 10), PD-L1 antibody (n = 10), or CD4 and CD8 antibodies (n = 7). Data are represented as mean ± s.e.m., ****P < 0.0001, significance was determined using two-way analysis of variance (ANOVA). c–e Distribution histograms of log2 Fold-change (FC) for all 10 sgRNAs targeting Cd274 (c), Pdcd1 (d) or Ankrd52 (e) as indicated in red lines, overlaid on gray gradient depicting the overall distribution (Cut-off: |FC | > 1.5, P < 0.05 for enrichment or depletion, analyzed by edgeR). f, Volcano plot for selected top guides for Cd274 and Ankrd52 (Cut-off: |FC | > 1.5, P < 0.05, analyzed by MAGeCK). g In vivo competition assay with equal number mixture of MC38 cells infected with sgRNA for non-targeting control (NT) or Ankrd52 (An) in WT mice (n = 5) and nude mice (n = 5). Data are represented as mean ± s.e.m., ***P = 0.0004, ****P < 0.0001, significance was determined using two-tailed unpaired Student’s t-test to compare sgAnkrd52 vs sgNT #2. h, i, Flow cytometry analysis of CD4+ (h) and CD8+ (i) T cell populations from NT and Ankrd52 knockout (An KO) tumors (n = 5 per group). Data are representative of two independent experiments and represented as mean ± s.e.m., significance was determined using two-tailed unpaired Student’s t-test. See also Supplementary Fig. 2–5. Source data are provided as a source data file.

