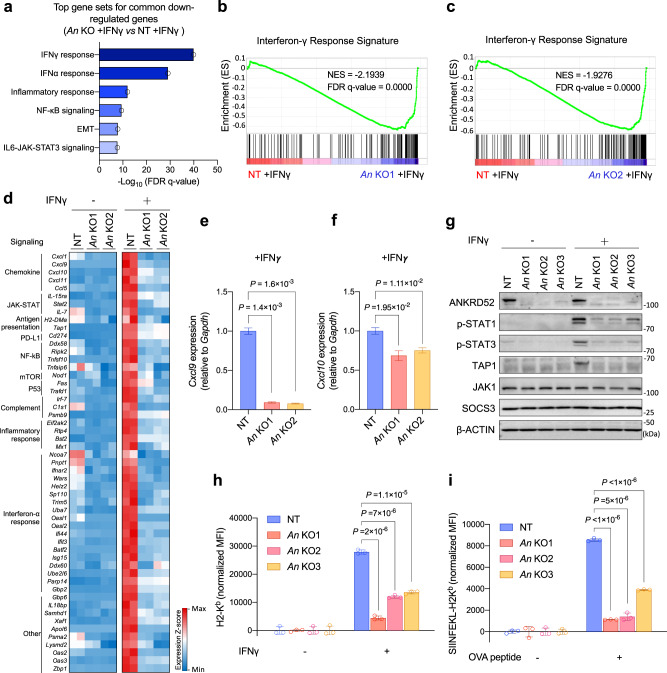
Fig. 4. ANKRD52 inactivation attenuates IFNγ signaling, chemokine expression, and antigen presentation.
a Hallmark gene sets enriched for commonly down-regulated genes in Ankrd52-null (both An KO1 and An KO2, 1.5-fold-change cut-off, P < 0.05, analyzed by edgeR) MC38 cells compared to control cells after IFNγ treatment. b, c Enrichment of genes associated with IFNγ response in Ankrd52-null cells exposed to IFNγ. d Heatmap showing down-regulated IFNγ responsive gene expression in Ankrd52-null cells by RNA-seq analysis (n = 2 per group per condition). e, f Cxcl9 (e) and Cxcl10 (f) mRNA level in control and ANKRD52-null MC38 cells treated with IFNγ (n = 3 per group). Data are representative of two independent experiments and represented as mean ± s.e.m., significance was determined using two-tailed unpaired Student’s t-test. g Abundance of IFNγ signaling proteins in control and Ankrd52-null MC38 cells treated with IFNγ. Data are representative of five independent experiments. h Abundance of membrane MHC-I expression in control and Ankrd52-null MC38 cells after treatment with IFNγ. MFI (mean fluorescence intensity) of H2-Kb was normalized by the responding group without IFNγ treatment (n = 3 per group per condition). Data are representative of four independent experiments and represented as mean ± s.d., significance was determined using two-tailed unpaired Student’s t-test. i Presentation of OVA-derived peptide (SIINFEKL) in OVA-treated control and Ankrd52-null MC38 cells. MFI of SIINFEKL-H2Kb was normalized by the responding group without IFNγ treatment (n = 3 per group per condition). Data are representative of three independent experiments and represented as mean ± s.d., significance was determined using two-tailed unpaired Student’s t-test. See also Supplementary Figs. 8 and 9. Source data are provided as a source data file.

