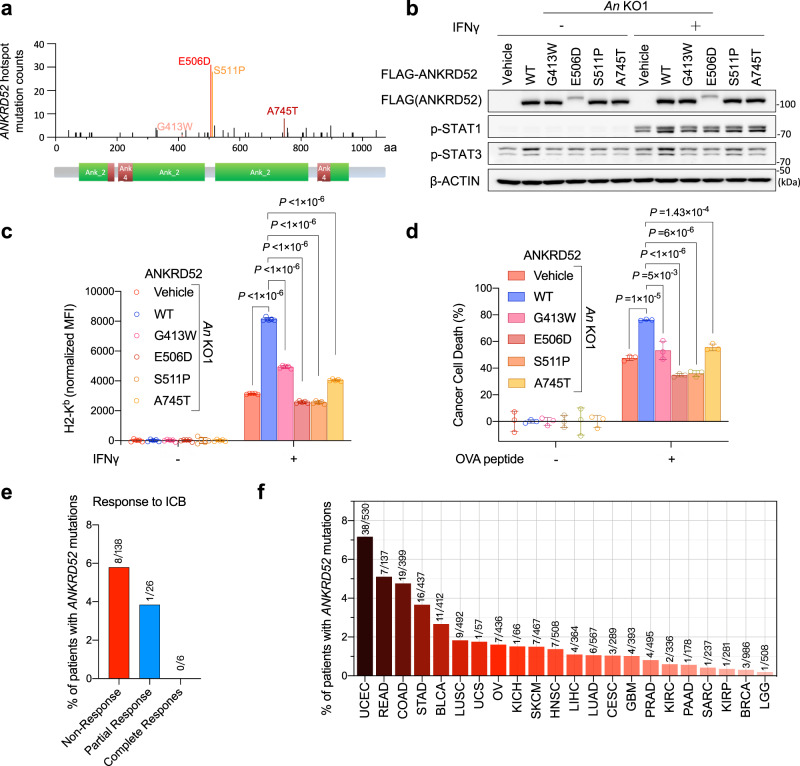
Fig. 5. Hotspot ANKRD52 mutations in patients impair IFNγ and T cell response.
a Localization of clinical hotspot ANKRD52 mutations from combined COSMIC and OncoWuXi database. b Protein abundance of p-STAT1 and p-STAT3 in Ankrd52-null MC38 cells expressing WT or indicated mutant ANKRD52 after IFNγ treatment. Data are representative of two independent experiments. c Membrane MHC-I level in Ankrd52-null MC38 cells expressing WT or indicated mutant ANKRD52 after IFNγ treatment. MFI of H2-Kb was normalized by the responding group without IFNγ treatment (n = 5 per group per condition). Data are representative of two independent experiments and represented as mean ± s.d., significance was determined using two-tailed unpaired Student’s t-test. d Killing of OVA-treated Ankrd52-null MC38 cells expressing WT or mutant ANKRD52 by OT-I T cells (n = 3 per group per condition). Data are representative of two independent experiments and represented as mean ± s.d., significance was determined using two-tailed unpaired Student’s t-test. e Bar plot showing the percentage of patients with mutations in ANKRD52 across cancer patients receiving ICB therapies (anti-CTLA-4 or anti-PD-1) reported by Van Allen et al., Science 2015 and Riaz et al., Cell 2017. The non-response group is composed of SD and PD. f Bar plot showing the percentage of patients with mutations in ANKRD52 across multiple cancer types. Source data are provided as a source data file.

