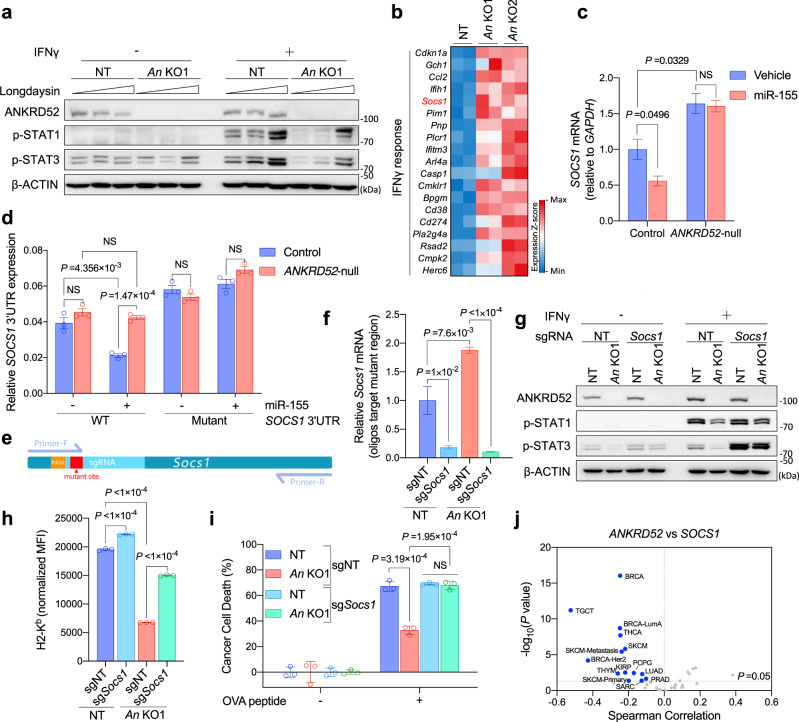
Fig. 6. ANKRD52 is required for miRNA-mediated silencing of SOCS1 to regulate T cell response.
a p-STAT1 and p-STAT3 abundance in MC38 cells treated with IFNγ and increasing Longdaysin (0, 50, 100 μM, a CK1α inhibitor). Data are representative of three independent experiments. b Heatmap showing commonly upregulated gene expression of IFNγ signaling by RNA-seq analysis of Ankrd52-null MC38 cells (n = 2 replicates per group). c SOCS1 mRNA level in control and ANKRD52-null 293 T cells overexpressing miR-155 (n = 3 per group per condition). Data are representative of two independent experiments and represented as mean ± s.e.m., significance was determined using two-tailed unpaired Student’s t-test. d Activity of WT and mutant SOCS1 3’UTR (Rluc/Fluc) in a dual-luciferase reporter in 293 T cells overexpressing miR-155 (n = 3 per group per condition). Data are representative of three independent experiments and represented as mean ± s.e.m., significance was determined using two-tailed unpaired Student’s t-test. e Schematic overview of qPCR test targeting mutant region to check Socs1 knockout efficiency. f Socs1 mRNA level tested by qPCR targeting mutant region in Ankrd52-null MC38 cells with inactivated SOCS1 (n = 5 per group). Data are represented as mean ± s.e.m., significance was determined using two-tailed unpaired Student’s t-test. g p-STAT1 and p-STAT3 abundance in Ankrd52-null MC38 cells with inactivated SOCS1 after IFNγ treatment. Data are representative of three independent experiments. h Membrane MHC-1 expression in Ankrd52-null MC38 cells with inactivated SOCS1 after IFNγ treatment. MFI of H2-Kb was normalized by the responding group without IFNγ treatment (n = 3 per group per condition). Data are representative of two independent experiments and represented as mean ± s.d., significance was determined using two-tailed unpaired Student’s t-test. i Killing of OVA-treated Ankrd52-null MC38 cells with inactivated SOCS1 by OT-I T cells (n = 3 per group per condition). Data are representative of two independent experiments and represented as mean ± s.d., significance was determined using two-tailed unpaired Student’s t-test. j Volcano plot showing the Spearman’s correlation and estimated significance of ANKRD52 with SOCS1 mRNA levels across all TCGA cancer types. Each dot represents a cancer type, blue dots indicate significant negative correlations (P < 0.05, TIMER). See also Supplementary Figs. 10 and 11. Source data are provided as a source data file.

