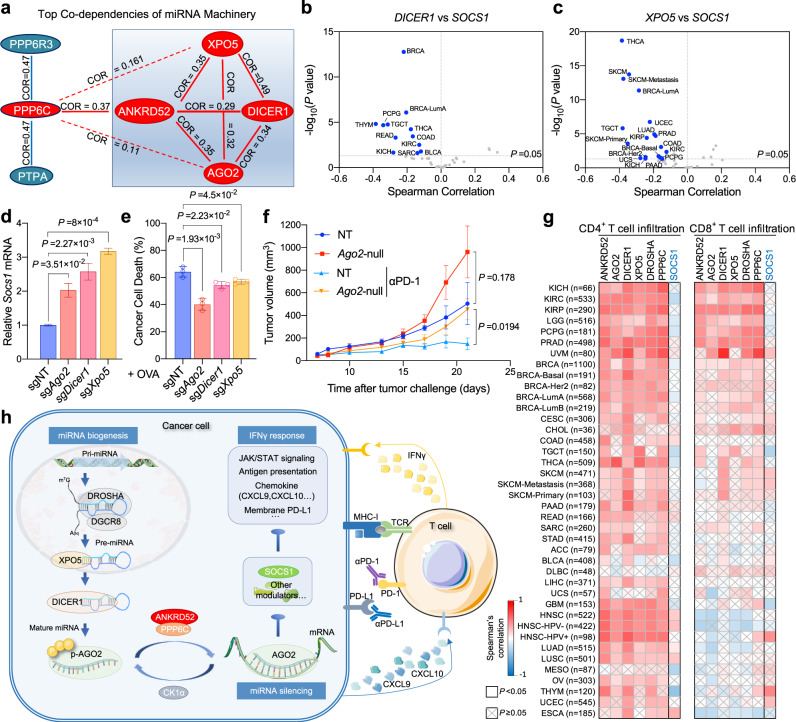
Fig. 7. Inactivation of miRNA machinery promotes cancer-intrinsic escape from T cell elimination.
a Diagram showing the Spearman’s correlation of top co-dependent proteins with ANKRD52 or PPP6C in CRISPR (Avana) Public 20Q3 database. Solid lines depict significant positive correlations (Correlation > 0.25, P < 0.001) and dashed lines depict weak correlation (Correlation > 0.1, P < 0.01). b, c Volcano plot showing the Spearman’s correlation and estimated significance of DICER1 (b) or XPO5 (c) with SOCS1 mRNA levels from RNA-seq data across all TCGA cancer types. Each dot represents a cancer type in TCGA; blue dots indicate significant negative correlations (P < 0.05, TIMER). d SOCS1 mRNA level in MC38 cells with targeted sgRNAs (n = 3 per group). Data are representative of three independent experiments and represented as mean ± s.e.m., significance was determined using two-tailed unpaired Student’s t-test. e Killing of OVA-treated MC38 cells with targeted sgRNAs by OT-I T cells (n = 3 per group per condition). Data are representative of two independent experiments and represented as mean ± s.d., significance was determined using two-tailed unpaired Student’s t-test. f Tumor growth curves of Ago2-null or control MC38 tumors in WT mice treated with PD-1 antibody or not (n = 5 for NT tumor, n = 6 for NT with anti-PD-1 and n = 7 for Ago2-null with or without anti-PD-1). Data are represented as mean ± s.e.m., significance was determined using two-tailed unpaired Student’s t-test. g Heatmap showing the Spearman’s correlation of ANKRD52, AGO2, DICER1, XPO5, DROSHA, PPP6C, or SOCS1 mRNA levels with CD4+ and CD8+ T cell abundance in tumors across all TCGA cancer types. h Model of miRNA machinery in regulation of cancer-intrinsic evasion from T cell attack. See also Supplementary Figs. 12–15. Source data are provided as a source data file.

