Figure 4.
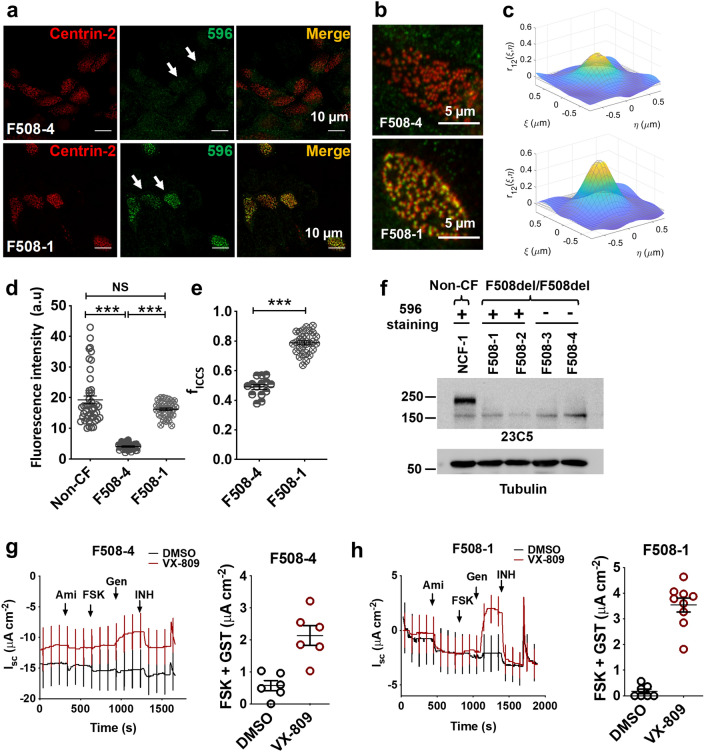
Apical 596 immunofluorescence in pHBE cells isolated from a subset of F508del/F508del patients. (a) Confocal images of apical immunofluorescence using well differentiated HBE cells from two F508del/F508del patients, one 596- (F508-4, top row) and the other 596+ (F508-1, bottom row). Colocalization with centrin-2 immunofluorescence confirmed expression in ciliated cells (merge). (b) Confocal images of the apical surface of F508-4 (top row) and F508-1 (bottom row) immunostained with 596 (green) and centrin-2 (red) antibodies used for image cross-correlation spectroscopy analysis. (c) Examples of spatial cross-correlation functions calculated using ICCS analysis from sub-regions (64 × 64 pixels) of the ciliated region images used to determine colocalization values; i.e. fractions of interacting particles per beam area in the green channel (M1) and the red channel (M2), for F508-4 (top) and F508-1 (bottom). (d) Summary of apical 596 immunofluorescence intensities in F508-4 and F508-1 cells. Intensity was normalized to the excitation power, (mean ± SD, n = 28—34, ***p < 0.0001, one-way ANOVA). (e) Colocalized fraction fICCS extracted from ICCS analysis (mean ± SD, n = 14–26, ***p = 6 × 10⁻¹⁶, t-test). (f) Immunoblot of lysates from well differentiated F508del/F508del HBE cells probed with antibody 23C5 against the R domain of CFTR. (g, h, these images are from one blot). Short-circuit current recordings and summaries of maximal cAMP responses after 24 h pretreatment with vehicle (DMSO, black) or the corrector VX-809 (1 µM, red). Cells were exposed sequentially to amiloride (Ami; 100 µM), forskolin (FSK; 10 µM) and genistein (Gen; 50 µM). Currents were inhibited using CFTRinh-172 (INH; 10 µM). Note that under control conditions (DMSO), F508-1 cells with apical 596 immunofluorescence had smaller stimulated currents compared to F508-4 cells that were 596-.

