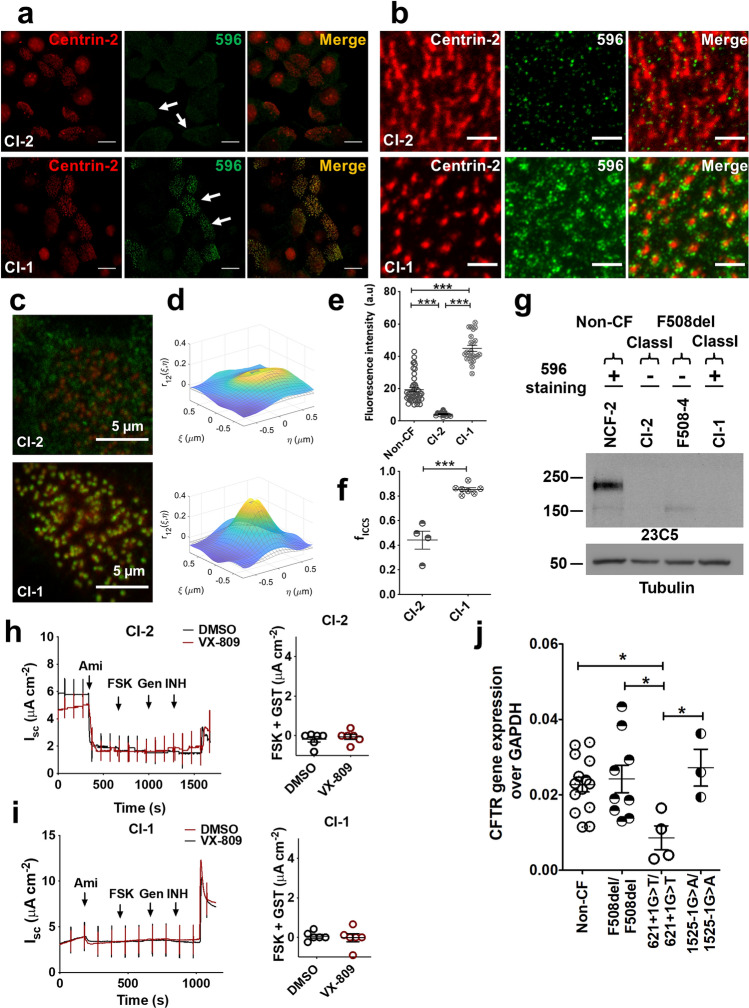
Figure 5.
Apical 596 immunofluorescence in ciliated cells that are homozygous for Class I CFTR mutations. (a) Confocal images of well differentiated pHBE cells from patients homozygous for 1525-1G > A (CI-2, top row) or 621 + 1G > T (CI-1, bottom row). (b) Representative STED images of the apical surface of CI-2 (top row) or CI-1 (bottom row) cells. (c) Confocal images of the apical surface of CI-2 (top row) and CI-1 (bottom row) cells immunostained with 596 and centrin-2 antibodies used for ICCS analysis. (d) Examples of spatial cross-correlation functions calculated via ICCS analysis from sub-regions (64 × 64 pixels) of the ciliated region images used to calculate colocalization values for CI-2 (top) and CI-1 (bottom). (e) Fluorescence intensity of 596 immunostaining at the apical pole of CI-2 and CI-1 cells (mean ± SE, n = 12–23, ***p < 0.0001, one-way ANOVA). Intensity was normalized to the excitation power. (f) Colocalized fraction fICCS extracted from ICCS analysis (mean ± SD, n = 3–6, ***p = 5 × 10⁻⁵, t-test). (g) Immunoblot of well differentiated HBE cells from non-CF, class I mutations, or F508del, probed for CFTR using the mAb23C5. Note that CI-1 cells are immunostained by 596 but do not have detectable CFTR protein (h, I, these images are from one blot). Representative short-circuit current recordings and after pretreatment with DMSO (black) or VX-809 (1 µM, red) for 24 h. Cells were exposed to amiloride (Ami; 100 µM), forskolin (FSK; 10 µM), genistein (Gen; 50 µM) and CFTRinh-172 (INH; 10 µM). The histogram shows stimulations induced by FSK + Gen. (j) CFTR mRNA levels in well differentiated HBE cells from non-CF donors and patients homozygous for F508del and a Class I mutation. Data were obtained by qPCR using primers that amplify sequence near the 5’ end of the transcripts and results were normalized to GAPDH (mean ± SE, n = 3–14; non-CF vs 621 + 1G > T/621 + 1G > T, *p = 0.0360; F508del/F508del vs 621 + 1G > T/621 + 1G > T, *p = 0.02727; 1525-1G > A/1525-1G > A vs 621 + 1G > T/621 + 1G > T, *p = 0.0413; one-way ANOVA). Individual points represent independent measurements.

