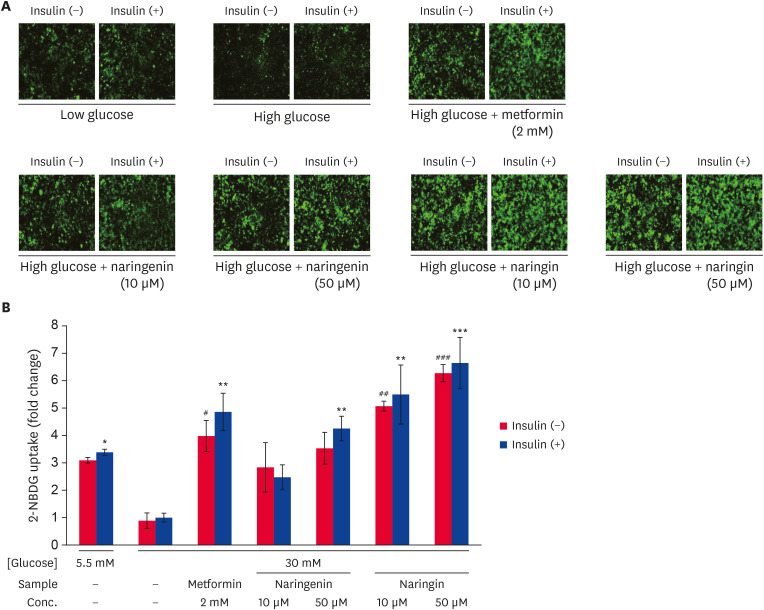
Fig. 2. Effect of naringenin and naringin on glucose uptake. The glucose uptake assay was done using the fluorescent D-glucose analog 2-NBDG. The HepG2 cells were serum-starved for 12 h and incubated in serum-free medium containing either normal (5.5 mM) or high glucose (30 mM) concentrations for an additional 24 h in the presence and absence of samples. The cells were then stimulated with or without insulin (100 nM) and 2-NBDG (50 uM) for 30 min. 2-NBDG uptake by cells was detected by IncuZyte Zoom at 20× magnification. Representative images for each sample (A), Quantitative 2NBDG uptake from each sample (B). The values are mean ± SE.
*p < 0.05, **p < 0.005, and ***p < 0.0005 vs. insulin-stimulated high glucose control and #p < 0.05, ##p < 0.005, and ###p < 0.0005 vs. without insulin-stimulated high glucose control.

